Transcription of Statistical Analysis 9: Some reliability measures
1 1 Statistical Analysis 9: some reliability measures Research question type: reliability of repeated measurements What kind of variables? Continuous (scale/interval/ratio) Common Applications: A repeatability study required to help establish and quantify reproducibility, and thus provide an indication of the 'test-retest' reliability of a measurement. The measurements could be from two people (or two types of equipment), or the same person on two, or more, occasions. Table 1 shows data used for illustration in the following examples. These examples are based on those provided by Rankin & Stokes (1998), of which a pdf and data files can be found in W:\EC\STUDENT\ MATHS SUPPORT CENTRE STATS WORKSHEETS\.
2 Two techniques exploring the variability of the data to gauge reliability are demonstrated; intraclass correlation coefficient (ICC) and Bland & Altman plot. Both SPSS and MS Excel are used in this worksheet. There are various forms of ICC and they are discussed in the paper, along with their associated labels and formulae for calculation, although the worksheet uses SPSS for their calculations. The Bland & Altman plot is illustrated in MS Excel. An ICC is measured on a scale of 0 to 1; 1 represents perfect reliability with no measurement error, whereas 0 indicates no reliability . Table 1: Collected data from 2 therapists (GR & MS) Participant Therapist 1 (GR) 1st reading Therapist 2 (MS) Therapist 1 (GR) 2nd reading 1 2 3 4 5 6 7 8 9 10 Example 1 (Interrater reliability ): A comparison of the reliability of measurements from two therapists was performed.
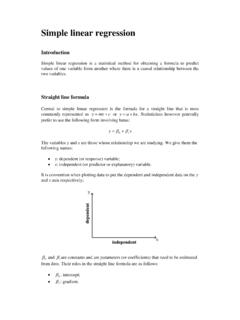
3 Data from real time ultrasound imaging of a muscle in 10 participants, one reading per therapist, are recorded in columns 2 and 3 in Table 1. [NB At this stage we are not using the second set of readings] Research question: Do the two therapists produce 'reliable' readings? Loughborough University Mathematics Learning Support Centre 2 Coventry University Mathematics Support Centre Steps in SPSS (PASW) to obtain an ICC: With data entered as shown in columns 1-3 in Figure 1 (see ) - choose Analyse>Scale> - move the variables for comparison into the Items: list (in this case Therapist1 and Therapist2) - select the button - select Intraclass Correlation Coefficient - select Item in the Descriptives for list - select Consistency in the Type: list - Continue and OK Figure 1: Steps in SPSS to obtain ICC Results.
4 Tables 2 & 3 show some of the output from the reliability Analysis , showing the mean (SD) of the data from each therapist. Overall, it appears that therapist 2 measures slightly higher and more variably than therapist 1 (see means & standard deviations in Table 2). Table 3 shows information relating to the ICC calculations. Use the 'Single measures ' option, as individual values are collected. Our estimated reliability between therapists is , with 95% CI ( , ), which is quite 'wide'. Conclusion: We have evidence to support the reliability of this measurement between the two therapists.
5 See the Rankin & Stokes paper for more detail in the calculation of this ICC. There are several ICCs this one is coded (3,1) Table 2: Item Statistics Mean Std. Deviation N Therapist1 10 Therapist2 10 Table 3: Intraclass Correlation Coefficient Intraclass Correlation 95% Confidence Interval F Test with True Value 0 Lower Bound Upper Bound Value df1 df2 Sig Single measures .92 .72 .98 9 9 .000 Average measures .96 .84 .99 9 9 .000 Consistency ICC 3 An alternative (and supporting) way of exploring the reliability of the measurements between the two therapists is to do a Bland and Altman plot (see Rankin, 1998 for details).
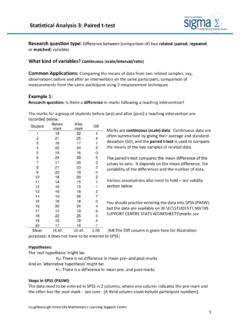
6 This approach is based on Analysis of the differences between measurements, suggesting that estimates of 'agreement' between measurements may be better than reliability coefficients (Rankin, 1998). Steps in MS Excel to obtain a Bland & Altman plot: With data entered as shown in Figure 1 ( ): calculate the mean and difference of the two sets of readings in the next columns plot the differences against the means by choosing a scatterplot (Figure 2) [The points should show no patterns here there seem to be more points towards the bottom right-hand corner think about what this implies] calculate the mean and SD of the differences (in this example these are and , resp.)
7 [NB The closer these values are to zero the better the agreement in measurements] 95% limits of agreement (LOA) can be calculated: (mean of diffs) 2(SD of diffs); [ and , in this example]. These lines can be superimposed on the chart using the drawing tools if you wish. other values can also be calculated see Rankin (1998) Example 2 (Intrarater reliability ): A comparison of reliability measures from one therapist performed on two occasions. Data are recorded in Table 1 above for Therapist 1 in columns 2 and 4. Research question: Does therapist 1 produce reliable readings on two separate occasions?
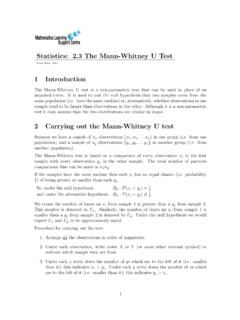
8 [This example is also based on that provided by Rankin & Stokes (1998) in the above paper for day 2 readings.] Steps in SPSS (PASW) to obtain an ICC: With data entered as shown in columns 1, 2 & 4 in Figure 1 ( ), follow the steps outlined above, but choose a One-Way Random from the Model: list. Read from the 'Single measures row. This is labelled ICC (1,1). Figure 2 Results: The ICC = , with 95% CI ( , ). Hence, there is evidence for the repeatability of measurements between scans for therapist 1. A copy of the Bland and Altman plot for this data is given in , which shows good agreement for most cases (seven are nearer zero), but with one outlier (ie one value outside the LOA).
9 You might like to repeat the Analysis for the data given in the paper for day 1, and compare your results with those given in Table 4 on page 191 of the paper, and the plot in Figure 2 on page 192. Comments The Rankin & Stokes (1998) paper gives much more detailed discussion around measures of reliability . In particular they give references for the following comments: Pearson s correlation coefficient is an inappropriate measure of reliability because the strength of linear association, and not agreement, is measured (it is possible to have a high degree of correlation when agreement is poor.)
10 A paired t-test assesses whether there is any evidence that two sets of measurements agree on average. However, it is the difference between within-subjects scores that is of interest (taking the mean score of all subjects has potential to provide misleading estimates). A high scatter of individual differences can result in the difference between the means being non-significant. It is no longer considered to be appropriate (in most cases) to use the coefficient of variation (CV) to calculate reliability . 'Single measure ' applies to single measurements for example, the rating of judges, individual item scores, or the body weights of individuals.