Transcription of ROCKET FUEL: QUANTIFIED SELF DIGITAL TOOLS
1 ROCKET fuel : QUANTIFIED self DIGITAL TOOLS A CPG MARKETING OPPORTUNITYQ4 20141 ROCKET fuel : QUANTIFIED self DIGITAL TOOLS Q4 2014 OVERVIEWQ uantified self (QS) is an emerging area of technology that allows consumers to use a variety of DIGITAL TOOLS to collect data and learn about their behaviors and habits of everyday life. The increasing number QS DIGITAL TOOLS available today includes smartwatches, wearable fitness trackers, apps, and websites. As consumers continue to integrate these new QS DIGITAL TOOLS into their lives, the data collected by these TOOLS presents new opportunities for CPG marketers to learn more about consumers behavior and better reach their target better understand this new technology trend and assess its impact on the future of DIGITAL media for CPG marketers, ROCKET fuel conducted a custom primary research study among consumers in the to: Understand consumers interest in using health and fitness QS TOOLS Gauge current usage of health and fitness QS TOOLS Understand the impact of health and fitness QS TOOLS on consumer behavior Evaluate consumers openness to sharing their QS data with CPG advertisersThis survey was conducted online using a trusted third-party research vendor and fielded from December 3 10, 2014, among 1,262 total respondents who live in the , use a computer regularly, and either currently use a QUANTIFIED self tool to track their health and fitness or who are interested in using a QUANTIFIED self tool to track their health and fitness.
2 56% of consumers qualified for our study. All market-sizing data is based to 2,245 total respondents with sample composition representative of the DETAILS2 ROCKET fuel : QUANTIFIED self DIGITAL TOOLS Q4 2014 MARKET SIZINGONE IN THREE CONSUMERS CURRENTLY USES A QS tool TO TRACK THEIR HEALTH AND TOOLS are gaining traction among consumers, with 31% currently using a QS tool to track their health and fitness, food, diet, sleep, and/or mood. Additionally, 20% of consumers have someone else in their household who uses a QS tool , and 25% of consumers are non-users but are interested in using a QS tool for health and fitness. Nearly one in five consumers planned to give a QS tool to someone as a gift this holiday season, further demonstrating the appetite for these types of DIGITAL TOOLS and the desire to track health and fitness behavior to total consumers, ages 18-64 (n=2,245)*including wearable devices, apps, and websites 18% OF CONSUMERS PLAN TO GIVE A QS tool AS A GIFT TO SOMEONE THIS HOLIDAY SEASON 20% OF CONSUMERS HAVE SOMEONE ELSE IN THEIR HOUSEHOLD WHO USES A QS tool FOR HEALTH AND FITNESS 25% OF CONSUMERS WHO ARE NOT USING A QS tool TO TRACK THEIR HEALTH AND FITNESS ARE INTERESTED IN USING ONE 31% OF CONSUMERS CURRENTLY USE A QS tool TO TRACK THEIR HEALTH AND FITNESS*3 ROCKET fuel .
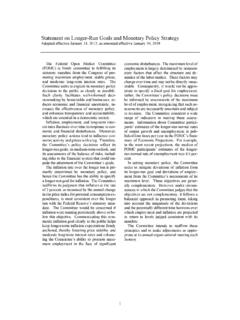
3 QUANTIFIED self DIGITAL TOOLS Q4 201416% OF CONSUMERS USE A WEARABLE HEALTH AND FITNESS TRACKING DEVICEFITBIT AND NIKE+ FUELBAND ARE THE MOST POPULAR WEARABLE FITNESS TRACKERS USED TODAY, BUT STANDALONE WEBSITES AND APPS ARE EVEN MORE POPULAR THAN WEARABLES TO TRACK HEALTH AND FITNESS. Wearable health and fitness trackers are becoming more and more popular among consumers. 16% of consumers own a wearable fitness tracker, with Fitbit and Nike + FuelBand being the most common brands owned. Half (51%) of those who use wearable trackers use an app to track the health and fitness metrics collected by their wearable device, while 24% use a website, and 25% use both an app and a website. 14% of consumers say they are likely to purchase a wearable fitness tracking device in the next six months, while 12% are still devices are not the only QS TOOLS consumers use: 29% of consumers use a website or an app not associated with a wearable QS tool to track their health and fitness.
4 This includes 88% of wearable users demonstrating the voracious appetite these consumers have for their behavioral data. My Fitness Pal is by far the most common website/app used, while a few others that were mentioned include: Nike+, WebMD, Map My Fitness, Apple Health, Spark People, Lose it, and Run & FITNESS TOOLS29% OF CONSUMERS USE A WEBSITE OR AN APP NOT ASSOCIATED WITH A WEARABLE DEVICE TO TRACK THEIR HEALTH AND FITNESS14% OF CONSUMERS SAY THEY ARE LIKELY TO PURCHASE A WEARABLE DEVICE IN THE NEXT SIX MONTHSB ased to total consumers, ages 18-64 (n=2,245)I own and use itNever heard of itAware of it, but don t own oneFitbitNike+ FuelBandSamsung Gear FitMicrosoft BandGarmin Vivofit Fitness BandJawbone UpOmronPebble SmartwatchBasis Peak60%28%12%60%31%10%50%44%6%40%55%5%41 %54%4%42%55%3%26%70%3%29%68%3%21%77%2%WE ARABLE QUANTIFIED self HEATH AND FITNESSB ased to consumers who own and use a QUANTIFIED self health and fitness tracker or are interested in using one (n=1,262)4 ROCKET fuel .
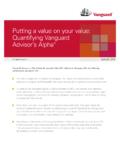
5 QUANTIFIED self DIGITAL TOOLS Q4 2014QS USERS TEND TO SKEW YOUNGER (AGES 25-44), AND EITHER HISPANIC OR AFRICAN AMERICAN. THEY ARE MORE LIKELY TO HAVE HIGHER TECH OWNERSHIP, HIGHER EDUCATION, BE EMPLOYED FULL TIME, MARRIED, AND HAVE HIGHER HOUSEHOLD INCOME THAN INTERESTED OF QS USERS AND INTERESTED NON-USERSQS usersInterested non-users% of total sampleMaleFemale18 to 2425 to 3435 to 4445 to 5455 to 64 White/CaucasianHispanicAfrican-AmericanO wn a smartphoneOwn a tabletCollege degreeGraduate degreeDoctorate degreeEmployed Full-timeMarriedHHI $100,000 - $124,999 HHI $125,000 or more60%28%26%29%21%45%55%47%44%53%56%30% 9%9%16%28%22%18%27%14%27%14%9%13%10%52%7 7%41%33%24%13%4%3%54%68%64%53%14%11%17%1 1%87%96%73%81%DEMOGRAPHIC PROFILE OF QS USERS AND INTERESTED NON-USERSB ased to QS users (n=699) and Interested non-users (n=563)5 ROCKET fuel : QUANTIFIED self DIGITAL TOOLS Q4 2014 USAGE OF HEALTH AND FITNESS TOOLSWEIGHT, CALORIES, AND DISTANCE ARE TRACKED MOST OFTEN.
6 METRICS ARE CHECKED VERY FREQUENTLY A FEW TIMES A WEEK OR who use a QS tool for health and fitness most often track their weight, calories, distance traveled, diet, and heart rate. Women are more likely to track their diet (calories consumed) than men, while men are more likely to track their heart rate, blood pressure, body fat, and running speed than women. Those who use a wearable device are more likely to track all metrics than those who just use an app or website, especially quality of sleep, mood, body fat, heart rate, and average who use a wearable device check their health and fitness metrics more frequently than those who only use an app or website (83% a few times a week vs. 60%). In general, women are more likely to check their metrics daily than men (34% vs. 28%). On average, consumers had been using QS TOOLS for nine months to track their health and fitness51%47%47%42%33%25%25%24%21%13%Wei ghtNumber of calories burnedNumber of steps you takeDiet (calories consumed)Heart rateBlood pressureQuality of sleepBody fatAverage running speedMood39%Every dayA few timesa weekOnce a weekA few timesa monthOnce a monthLess than oncea monthWearable Device UsersWebsite/App Users (non-wearable users)24%44%36%12%17%3%9%1%3%2%11%HEALTH AND FITNESS METRICS TRACKED USING QS TOOLSB ased to QS users (n=699)FREQUENCY OF CHECKIG HEALTH AND FITNESS METRICSB ased to wearable QS users (n=349), Website/app users but non-wearable users (n=350)FUN FACT: Aggregated sleep data from Jawbone Up users in the San Francisco area shows an interesting trend of sleep interruption at the time of the recent earthquake by distance of users from the epicenter.
7 (Aug 2014, )6 ROCKET fuel : QUANTIFIED self DIGITAL TOOLS Q4 2014 IMPACT OF HEALTH AND FITNESS TOOLS ON LIFESTYLECONSUMERS HAVE DRAMATICALLY CHANGED THEIR LIFESTYLES AND BEHAVIORS AS A RESULT OF USING QS of QS TOOLS are much more likely to have experienced positive, healthier life changes within the last year than non-users, especially related to eating healthier, exercising more, and being in better shape overall. Wearable device users are more likely to have experienced all of these life changes within the past year relative to website/apps users who don t use wearably. Most notably they are more likely to have higher endurance, sleep better/more, and run faster/longer tool UsersInterested Non-usersYou are eating healthier60%34%51%You exercise more25%50%You are in better shape21%41%You are happier27%40%You are healthier overall23%39%You ve lost weight26%37%Your mood is better26%36%You sleep better19%32%You are eating less26%29%You have higher endurance11%25%You sleep more17%24%You can run longer distances5%21%You can run faster4%19%None of these26%8%LIFE CHANGES AS COMPARED TO A YEAR AGOB ased to QS users (n=699) and Interested non-users (n=563)7 ROCKET fuel : QUANTIFIED self DIGITAL TOOLS Q4 2014 IMPACT OF HEALTH AND FITNESS TOOLS ON LIFESTYLENine in ten QS users say tracking their health and fitness metrics has impacted their lifestyle and behavior.
8 Many QS users say they have lost weight by using the TOOLS , they eat healthier, they are more aware of what they eat, they exercise more often, and they are more aware of their habits and progress in working toward a have also modified their purchasing habits as a result of using QS health and fitness TOOLS . CPG categories that have benefited from the usage of these TOOLS include fresh produce, vitamins/supplements, protein, and dairy, while spending in other categories has declined, such as frozen foods, carb-heavy foods, OTC/prescription drugs, and to QS users (n=699) CHANGE IN PURCHASE HABITS AS RESULT OF USING QS TOOLSB ased to QS users (n=699), Website/app users but non-wearable users (n=350)I now purchase more of these productsI purchase the same amount of these productsI now purchase less of these productsFresh produceVitamins and supplementsMeat, poultry, fish, eggsDairy productsNon-alcoholic beveragesCooking TOOLS (pots, pans, utensils, etc.)
9 Personal-care productsFrozen foodsBread, snacks, cereal, chips, cookies, drugs60%27%13%Prescription drugs62%27%11%Alcohol51%38%11% IT MAKES ME EXERCISE MORE, EAT LESS, SLEEP BETTER, AND LIVE A HEALTHIER LIFE. I M MORE CONSCIOUS OF MY CALORIC INTAKE, I CHECK LABELS MORE OFTEN NOW. I WEIGH MYSELF WEEKLY NOW TO SEE IF I M ON THE RIGHT TRACK. I EAT BETTER, I PURPOSELY WALK AS MUCH AS POSSIBLE TO HIT MY GOAL IN STEPS FOR EVERY DAY. IT IS FUN AND EASY AND IT GIVES ME MORE ACCOUNTABILITY. I HAVE LOST OVER 70 POUNDS SINCE I STARTED USING THE WATCH. 90% OF HEALTH AND FITNESS QS USERS SAY USING THE TOOLS HAS IMPACTED THEIR LIFESTYLE AND fuel : QUANTIFIED self DIGITAL TOOLS Q4 2014 More than half of QS users check labels on food and beverage products and cook more often as a result of using QS TOOLS . One in four participating consumers have changed food brands as a result of using QS TOOLS , and nearly one in five have changed brands of personal-care products.
10 Men are more likely to have changed brands of personal-care products and started to take vitamins/supplements as a result of using the TOOLS , while women are more likely to have changed brands of food or beverage products, started to check calorie/nutrition information, and started to look for new recipes. CPG companies can align with these behavior trends by highlighting low-calorie and nutrient information in marketing messages, producing smaller product packaging to aid in portion control, and by providing healthy recipes featuring their products to appeal to this growing consumer OF HEALTH AND FITNESS TOOLS ON LIFESTYLEB ased on QS users (n=699)54%54%45%44%29%24%17%Check calorie/nutrition informationon food and beverage productsCook meals at home more oftenLook for new recipesTake vitamins/supplementsPurchase smaller quantities offood and beverage productsChanged brands of foodor beverage productsChanged brands ofpersonal-care productsACTIVITIES CONSUMERS HAVE DONE AS A RESULT OF USING QS TOOLSB ased on QS users (n=699)9 ROCKET fuel : QUANTIFIED self DIGITAL TOOLS Q4 2014 IMPACT OF HEALTH AND FITNESS TOOLS ON DIGITAL MEDIAQS USERS ARE MORE RECEPTIVE TO DIGITAL MEDIA THAN NON-USERS.