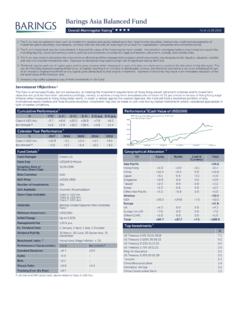
Transcription of Fact Sheet: State Street S&P Mid Cap Index Fund - …
1 INSTFUNDThe fund seeks to offer broad, low cost exposure to the stocks of medium sized ObjectiveThe State Street S&P Mid Cap Index fund seeks an investment return that approximates as closely as practicable, before expenses, the performance of the S&P MidCap 400 Index (the " Index ") over the long Strateg yThe fund is managed using a "passive" or "indexing" investment approach, by which SSGA attempts to match, before expenses, the performance of the Index . SSGA will typically attempt to invest in the equity securities comprising the Index , in approximately the same proportions as they are represented in the Index . Equity securities may include common stocks, preferred stocks, depository receipts, or other securities convertible into common stock.
2 The fund may purchase securities in their initial public offerings ("IPOs"). In some cases, it may not be possible or practicable to purchase all of the securities comprising the Index , or to hold them in the same weightings as they represent in the Index . In those circumstances, SSGA may employ a sampling or optimization technique to construct the portfolio in time to time securities are added to or removed from the Index . SSGA may sell securities that are represented in the Index , or purchase securities that are not yet represented in the Index , prior to or after their removal or addition to the fund may at times purchase or sell Index futures contracts, or options on those futures, or engage in other transactions involving the use of derivatives, in lieu of investment directly in the securities making up the Index or to enhance the fund 's replication of the Index return.
3 The fund 's return may not match the return of the Facts The fund is passively managed The fund may use futures and other derivatives The fund may invest in other investment pools, including those managed by SSGA and its affiliates The fund is not leveraged The fund will not sell securities shortState Street S&P Mid Cap Index fund - Class CState Street S&P Mid Cap Index fund Class C (the " fund ") represents units of ownership in the State Street S&P Mid Cap Index Non-Lending Series June 2018 PerformanceTotal ReturnsFundBenchmarkQ2 to Date (01 Oct 1997) Year Since Inception (2009) Year Since Inception (2008) returns are provided in accordance with the description of the fund 's total expense ratio information that can be found on the last page under the fee disclosure section of the fact sheet .
4 All returns greater than 1 year are annualized. Past performance is not a guarantee of future results. Current performance may be lower or higher than the performance shown above. fund returns reflect all items of income, gain and loss and the reinvestment of dividends and other income and are calculated in US dollars. Index returns are unmanaged and do not reflect the deduction of any fees or expenses. Index returns reflect all items of income, gain and loss and the reinvestment of dividends and other of $10,000 The hypothetical $10,000 investment chart is plotted quarterly, and includes reinvestment of dividends and capital gains.
5 There is no direct correlation between a hypothetical investment and the anticipated performance of the fund .'09'10'11'12'13'14'15'16'17'18$0$5, 000$10,000$15,000$20,000$25,000$30,000$2 7,759 The State Street S&P Mid Cap Index Securities Non-Lending Series fund Class C ("Class C") was offered to investors on 1 April 2009. Performance shown for Class C is from its inception date which is 4 June 2009 to the as of date above and reflects the Class C's fees as described in the last page under the fee section. Prior to 4 June 2009 performance shown is that of the State Street S&P Mid Cap Index Securities Non-Lending Series fund Class A ("Class A") which reflects the Class A fees.
6 Had Class C's fee been reflected to the performance calculated for the Class A, performance shown may have been lower. See the "Fee Disclosure" section on the last page for a complete description of the Total Annual Operating Expense Ratio of Class fund is a collective investment trust and is not FDIC insured, nor is it an obligation or deposit of, or guaranteed by State Street Corporation, SSGA or its S&P MidCap 400 is comprised of approximately 400 mid-cap securities and accounts for approximately 7% coverage of the stock market S&P MidCap 400 Index is a product of S&P Dow Jones Indices LLC ("SPDJI"), and has been licensed for use by SSGA.
7 Standard & Poor's and S&P are registered trademarks of Standard & Poor's Financial Services LLC ("S Dow Jones is a registered trademark of Dow Jones Trademark Holdings LLC ("Dow Jones"). SSGA's investment products are not sponsored, endorsed, sold or promoted by SPDJI, Dow Jones, S&P, their respective affiliates and none of such parties make any representation regarding the advisability of investing in such product(s) nor do they have any liability for any errors, omissions, or interruptions of the S&P MidCap 400 see the Fee Disclosure section on the last page for a complete disclosure of the fund 's total operating fact sheet provides summary information about the fund .)
8 It should be read in conjunction with the fund 's applicable Strategy Disclosure Document, which is available upon request. The Disclosure Document contains important information about the fund , including a description of a number of risks associated with investing in the Street Global AdvisorsCharacteristicsAnnual Dividend Yield (Trailing 12 Months) (Trailing 36 Months) 3-5 Year EPS (Forward 12 Months) Deviation (Annualized 36 Months) Number of Holdings401 Turnover (As-of FYE 12/31) Average Market Cap ($M)$5, HoldingsTELEFLEX S PIZZA TECHNOLOGIES HEALTH PLANS DYNAMICS DOMINION FREIGHT HENRY & ASSOCIATES supplemental information may be rounded and may result in the total not adding up to top holdings are presented to illustrate examples of the securities that the fund has bought and may not be representative of the fund 's current or future investments.
9 In the case of fixed income and cash funds the securities are aggregated and shown at the issuer level. The top holdings do not include other assets or instruments that may be held by the fund including, for example and not by way of limitation, cash or cash equivalents and derivatives such as futures, options and swaps. The figures presented are as of the date shown above, do not include the fund 's entire investment portfolio, and may change at any portfolio turnover rate is as-of the prior fiscal year-end ("FYE"). It is calculated consistent with Form N-1A by dividing the lesser amounts of purchases or sales of portfolio securities ( , underlying fund shares) for the fiscal year by the monthly average value of the portfolio securities owned by the fund during the fiscal characteristics are calculated using the month end market value of holdings except, if shown, for beta and standard deviation which use month end return values.
10 Averages reflect the market weight of securities in the portfolio. Market data, prices, and dividend estimates for characteristics calculations provided by FactSet Research Systems, Inc. All other portfolio data provided by SSGA. Characteristics are as of the date indicated, are subject to change, and should not be relied upon as current thereafter. Sector reporting based on the Global Industry Classification Standard ("GICS ") which was developed by and is the exclusive property and a service mark of MSCI Inc. ("MSCI") and Standard & Poor's, a division of The McGraw-Hill companies , Inc. ("S&P") and is licensed for use by State Street .