Transcription of The Ocular Surface Disease Index and the Symptom ...
1 Comparison of Two Questionnaires for Dry Eye Symptom Assessment The Ocular Surface Disease Index and the Symptom Assessment in Dry Eye Francisco Amparo, MD, MSc,1 Debra A. Schaumberg, OD, ScD,2,3 Reza Dana, MD, MPH1. Purpose: The aim of this study was to compare patient-reported symptoms of dry eye Disease (DED) as assessed by the Ocular Surface Disease Index (OSDI), a 12-item Symptom frequencyebased questionnaire, and the Symptom Assessment iN Dry Eye (SANDE), a 2-item frequency- and severity-based visual analog scale. Design: Clinic-based evaluation of a diagnostic test. Participants: A total of 114 patients with DED. Methods: Patients were administered the OSDI and SANDE questionnaires at baseline and follow-up visits to evaluate DED-related symptoms. The correlations between both questionnaires' scores were evaluated using the Spearman coef cient, and their clinical differences were assessed using BlandeAltman analysis.
2 Main Outcome Measures: Baseline and follow-up visit OSDI and SANDE dry eye Symptom scores. Results: At the baseline visit, the OSDI and SANDE questionnaire scores were signi cantly correlated (R ; P < ). Moreover, a signi cant correlation was found between changes in the OSDI and SANDE. scores from baseline to follow-up visits (R ; P < ). A BlandeAltman analysis, after score normalization, revealed a difference (bias) of less than 2 centesimal units between the scores of the 2 questionnaires. Conclusions: Data collected from the SANDE questionnaire showed a signi cant correlation and negligible score differences with those from the OSDI, suggesting that the SANDE visual analog scaleebased questionnaire has the potential to provide clinicians with a short, quick, and reliable measure for DED symptoms. Ophthalmology 2015;122:1498-1503 2015 by the American Academy of Ophthalmology.
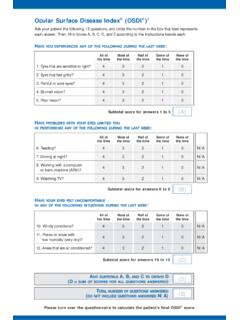
3 Dry eye Disease (DED) is a multifactorial disorder of the Ocular patient to complete, and the scores range from 0 to 100. Surface that affects millions of people in the United States On the basis of the score, the patient's symptoms can be It represents one of the most frequent reasons for categorized as normal (0e12), mild dry eye (13e22), ophthalmic consultations, with 5% to 30% of the general moderate dry eye (23e32), or severe dry eye population affected depending on the diagnostic criteria (33e100).9e12 The OSDI is copyrighted by Allergan, Inc. ,4 Dry eye Disease symptoms severely affect patients' The Symptom Assessment in Dry Eye (SANDE) is a activities of daily living, either continuously or triggered by short and intuitive questionnaire based on a visual analog speci c tasks ( , driving or computer monitor use).5 These scale that quanti es both severity and frequency of dry eye symptoms include discomfort, blurred vision, burning symptoms.
4 The SANDE comprises 2 questions, and each sensation, irritation, photophobia, and contact lens question uses a 100-mm horizontal linear visual analog The measurement of patients' signs and scale. The measurement of Symptom frequency ranges from symptoms, and their impact on patients' quality of life, are rarely to all of the time, and the Symptom severity critical aspects in DED evaluation. Because there is no gold ranges from very mild to very severe. 13,14 It has been standard diagnostic test for DED, a combination of signs shown that both tests are reliable and valid measures of dry and symptoms are commonly used as diagnostic eye ,13 The main objective of this study was to Because of the variability of dry eye symptoms and the compare the SANDE and OSDI questionnaires in a clinic- limitations of the available clinical tests, questionnaires that based cohort of patients with DED.
5 In addition, we sought record patients' symptoms are useful tools for diagnosis and to expand on evidence in support of the use of the SANDE. follow-up of ,7 The Ocular Surface Disease Index questionnaire for DED diagnosis and follow-up. (OSDI) (Allergan Inc, Irvine, CA)10 is one of the most frequently used instruments to assess DED. This Methods questionnaire comprises 12 questions and evaluates the frequency of symptoms over the preceding week. The This study was conducted in compliance with the institutional questionnaire requires approximately 5 minutes for the review board at the Massachusetts Eye and Ear In rmary, Boston, 1498 2015 by the American Academy of Ophthalmology Published by Elsevier Inc. ISSN 0161-6420/15. Amparo et al . Comparison between OSDI and SANDE Questionnaires Figure 1. The Symptom Assessment in Dry Eye (SANDE) questionnaire.
6 Massachusetts, in accordance with the tenets of the Declaration of Helsinki, and informed consent was obtained from all participants. Data were collected at the Cornea Service, Massachusetts Eye and Ear In rmary, from patients who had a previous diagnosis of DED. and were representative of the subset of DED seen in our clinic, a specialized Ocular Surface unit. The OSDI and SANDE scores from baseline and follow-up visits of a total of 114 patients were analyzed. Patients were selected on the basis of the following criteria at the initial visit: punctate epithelial keratopathy (corneal uorescein staining [CFS]). ; symptoms of dry eye ( , burning, irritation, grittiness, foreign body sensation, or uctuating vision); and OSDI. Patients who had signs of epitheliopathy (corneal staining). with minimal or no symptoms were not included; likewise, those with symptoms of Ocular irritation but without signs of epitheliopathy were not included.
7 Patients with active infection, history of allergy, refractive surgery, penetrating keratoplasty, and herpetic eye Disease , as well as contact lens wearers, were excluded. Corneal uorescein staining was evaluated using commercially available uorescein sodium strips, followed by slit-lamp examination with cobalt-blue light. Three minutes after application of uorescein, CFS was graded using the modi ed Oxford system (grades 0e5). At both visits, patients were asked to complete the OSDI and SANDE questionnaires, and the results were used to evaluate their symptoms. The 12-item OSDI questionnaire scores range from 0 to 100, and it contains 3 Ocular Symptom questions, 6 vision-related function questions, and 3 environmental trigger questions. Each question score ranges from 0 ( none of the time ) to 4 ( all of the Table 1. Baseline Characteristics of the Study Population Patient Characteristics Age, y (mean, SD) 15.)
8 Sex Female 71 (62%). Male 43 (38%). Eye-Speci c Characteristics Figure 2. Scatterplots showing the correlation between Symptom Assess- CFS (mean, SD) 2 ment in Dry Eye (SANDE) and Ocular Surface Disease Index (OSDI) scores Overall OSDI score (mean, SD) from patients with dry eye Disease at the baseline visit. A, Correlation be- Overall SANDE score (mean, SD) tween OSDI and SANDE scores (R ; P < ). B, Correlation between OSDI and SANDE scores in cases with severe symptoms (R ;. CFS corneal uorescein staining; OSDI Ocular Surface Disease Index ; P < ). C, Correlation between OSDI and SANDE scores in cases with SANDE Symptom Assessment iN Dry Eye; SD standard deviation. mild to moderate symptoms (R ; P ). 1499. Ophthalmology Volume 122, Number 7, July 2015. time ). The total score is calculated on the basis of the following formula: OSDI ([sum of scores for all questions answered.]
9 100]/[total number of questions answered 4]).10,11. The SANDE questionnaire comprises 2 questions: (1) How often do your eyes feel dry and/or irritated? and (2) How severe do you feel your symptoms of dryness and/or irritation are? This questionnaire uses a 100-mm horizontal line for each question to assess Ocular discomfort and/or dryness experienced by the pa- tients. In the SANDE questionnaire, frequency of symptoms ranges from rarely to all of the time, and the severity of symptoms ranges from very mild to very severe (Fig 1).13,14 At each visit, patients were asked to place a mark on the 2 given lines based on the extent of their symptoms. The locations of the marks made by the patients on the 100-mm horizontal lines were measured in millimeters from left to right and recorded. Data collected from the SANDE questionnaire were calculated by multiplying the fre- quency score by the severity score and obtaining the square ,14.
10 We then assessed the correlation between data obtained from the 2 questionnaires, including the change in symptoms between the 2 visits. Statistical analysis of the data and correlations between the questionnaires responses were assessed by the Spearman co- ef cient of correlation. A P value of less than was considered statistically signi cant. In addition, we evaluated the clinical dif- ferences between OSDI and SANDE using BlandeAltman anal- First, we compared the original scores obtained from the 2. questionnaires. Because the 2 methods do not measure symptoms in the same way (although both use a centesimal scale), we normalized the scores by applying the algebraic method of the norm of a vector (normalization to a norm of 1). Once the scores from both questionnaires were transformed to a normalized scale, we compared them using BlandeAltman analysis.