Transcription of Construction statistics in Great Britain, 2018
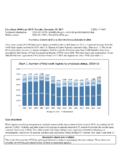
1 Health and Safety Executive Data up to March 2019 Annual statistics Published 30th October 2019. Construction statistics in Great Britain, 2019. Contents Key statistics ..2. Introduction ..4. Work-related ill health ..5. All illness ..5. Musculoskeletal Stress, depression or anxiety ..7. Other conditions ..9. Work-related injuries ..11. Fatalities .. 11. Non-fatal injuries .. 12. Workplace risks ..14. Economic Cost ..15. Enforcement ..16. Annex 1: Sources and definitions ..17. Annex 2: Links to detailed tables ..19. This document is available from Page 1 of 20. Key statistics in the Construction sector in Great Britain, 2019.
2 79,000. workers suffering from work-related ill health (new or long-standing). The rate of self-reported work-related ill health has been broadly flat in recent years. Sources: LFS, estimated 2018/19; LFS estimated annual average 2016/17-2018/19. 30 fatal injuries to workers in 2018/19p This is the similar to the annual average number of 36 fatalities for 2014/15-2018/19. Source: Source: RIDDOR, 2014/15-2018/19. Accident kinds are shown for the top five RIDDOR, 2018/19 causes of fatal injuries. Note: p is used in this document to indicate provisional figures due to be finalised in 2019/20.
3 This document is available from Page 2 of 20. 54,000. non-fatal injuries to workers each year The rate of self- reported non-fatal injury to workers shows a downward trend Source: LFS, estimated Source: Non-fatal injuries reported under RIDDOR 2016/17-2018/19. RIDDOR. annual average is used here as the LFS is not able to provide a breakdown to this level of 2016/17-2018/19. detail. Accident kinds are shown that account for 10% or more of injuries. This document is available from Page 3 of 20. Introduction This report provides a profile of workplace health and safety in construction1.
4 Construction includes three broad industry groups: Construction of buildings general Construction of buildings, including new work, repair, additions and alterations;. Civil engineering civil engineering work, including road and railway Construction , and utility projects; and Specialised Construction activities covering trades that usually specialise in one aspect, common to different structures. For example: demolition, electrical, plumbing, joinery, plastering, painting and glazing. There is an overlap between these groups, for example roofing work may be carried out by a specialist contractor and so included in Specialised Construction activities or by a general contractor as part of Construction of buildings.
5 This sector accounts for around 7% of the workforce in Great Britain2. 1. The Construction ' sector is defined by section F within the 2007 Standard Industrial Classification. See for more detail. 2. Annual Population Survey, 2018. This document is available from Page 4 of 20. Work-related ill health All illness In Construction : There were an estimated 79,000 work-related ill health cases (new or long- standing). 62% were musculoskeletal disorders Source: LFS, estimated annual average 2016/17-2018/19. Construction compared to industries with similar work activities Around of workers suffered from work-related ill health (new or long- standing cases).
6 This rate is not statistically significantly different to that for workers across all Source: LFS, estimated annual average 2016/17-2018/19. industries ( ). 95% confidence intervals are shown on the chart. Changes over time Source: LFS annual estimate, from 2001/02 to 2018/19. This document is available from Page 5 of 20. Work-related ill health Musculoskeletal disorders In Construction : There were an estimated 42,000 work-related cases of musculoskeletal disorder (new or long-standing), about three fifths of all ill health in this Sector Source: LFS, estimated 2018/19. Construction compared to industries with similar work activities Around of workers in the sector reported suffering from a musculoskeletal disorder they believed was work -related (new or long-standing cases).
7 This rate is statistically significantly higher than the rate for Source: LFS, estimated annual average 2016/17-2018/19. 95% workers across all confidence intervals are shown on the chart. industries ( ). Changes over time Source: LFS annual estimate, from 2001/02 to 2018/19. This document is available from Page 6 of 20. Work-related ill health Stress, depression or anxiety In Construction : There were an estimated 16,000 work-related cases of stress, depression or anxiety (new or long-standing), a quarter of all ill health in this Sector. Source: LFS, estimated annual average 2016/17-2018/19.
8 Construction compared to industries with similar work activities Around of workers in the sector reported suffering from stress, depression or anxiety they believed was work-related new or long-standing cases). This rate is statistically significantly lower than Source: LFS, estimated annual average 2016/17- the rate for workers 2018/19. across all industries ( ).3. 3 A research report published by the Office for National statistics indicates that the risk of suicide among low- skilled male labourers, particularly those working in Construction roles, was three times higher than the male national average.
9 It is not clear whether this increased risk is due to working within the Construction industry or other socio-economic factors. See tion/england2011to2015. This document is available from Page 7 of 20. Changes over time Source: LFS estimated annual average, from 2003/04 to 2018/19. This document is available from Page 8 of 20. Work-related ill health Other conditions Occupational asthma According to reports from the chest physician reporting scheme for occupational respiratory disease, the rate of occupational asthma is lower than the rate for all industries ( compared to per 100 000 workers, average annual rates 2016-2018p).
10 Airborne materials from spray painting, welding, or cutting/grinding metals are among the contributary factors to their ill health identified by those suffering from asthma. Source: The Health and Occupation Reporting network (THOR). Chronic Obstructive Pulmonary Disease (COPD). There are various causative factors linked to COPD including occupational exposure to fumes, chemicals and dusts and environmental pollution. Smoking is the single most important causative factor. A recent analysis of COPD, based on the UK Biobank study, identified a number of occupations for which the prevalence of COPD was significantly higher compared with all other occupations.