Transcription of CHARGE AND DISCHARGE OF A CAPACITOR - UPSCALE
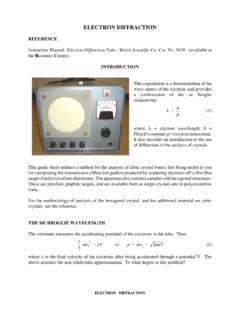
1 CHARGE AND DISCHARGE OF A CAPACITOR . REFERENCES. RC Circuits: Most Introductory Physics texts ( A. Halliday and Resnick, Physics ; M. Sternheim and J. Kane, General Physics.). Electrical Instruments: This Laboratory Manual: Commonly Used Instruments: The Oscilloscope and Signal Generator - Model 19. Stanley Wort and Richard Smith, Student Reference Manual for Electronic Instrumentation Laboratories (Prentice Hall 1990). Also see the video - Physics Skills; How to use the Oscilloscope - starring Dr Harrison. Circuit Wiring: This Laboratory Manual: Circuit- Wiring Techniques: Commonly Used Instruments; the Oscilloscope. OBJECTIVES. This lab will give you experience in: developing strategies to handle complex equipment such as oscilloscopes using an oscilloscope to measure a signal which varies regularly in time planning and wiring a simple circuit analyzing an exponential function obtained from data readings using the data analysis program on the Faraday computer INTRODUCTION.
2 There are numerous natural processes in which the rate of change of a quantity is proportional to that quantity. One biological example is the case of population growth in which the rate of increase of the number of members of a species is proportional to the number present. In this case the population is said to grow exponentially. A radioactive example is the case in which the rate of loss of the number of nuclei is proportional to the number of nuclei present. The number of nuclei decreases exponentially. You might think of other comparable exponential processes. CHARGE AND DISCHARGE OF A CAPACITOR . An electrical example of exponential decay is that of the DISCHARGE of a CAPACITOR through a resistor.
3 A CAPACITOR stores CHARGE , and the voltage V across the CAPACITOR is proportional to the CHARGE q stored, given by the relationship V = q/C, where C is called the capacitance. A resistor dissipates electrical energy, and the voltage V across it is proportional to the current (which is just the rate of flow of dq CHARGE ) through it, given by V R , where R is called dt the resistance. When a charged CAPACITOR is connected to a resistor, the CHARGE flows out of the CAPACITOR and the rate of loss of CHARGE on the CAPACITOR as the CHARGE flows through the resistor is proportional to the voltage, and thus to the total CHARGE present. dq q dq 1.
4 This can be expressed as : R so that q (1). dt C dt RC. t RC. which has the exponential solution q qo e where qo is the initial CHARGE on the CAPACITOR (at time t = 0). As the voltage across the CAPACITOR is proportional to its CHARGE , the voltage t V displays RC. the same exponential behaviour ; divide both sides by C to obtain V Vo e . This exponential decay of voltage may be likened to a water tank with a small hole in the bottom, filled with water, in which the flow or rate of loss of volume of water in the tank (analogous to the rate of loss of electrical CHARGE from the CAPACITOR ) is proportional to the pressure of the water as it exerts itself on the hole (analogous to the voltage across the resistor).
5 As the Figure 2. pressure is proportional to the height of water in the tank, which is in turn proportional to the total volume of water, we find that the volume of water and the pressure exhibit exponential decay . In this experiment, instead of merely discharging an already charged CAPACITOR , you will be using an Alternating Current (AC) square wave voltage supply to CHARGE the CAPACITOR through the resistor many times per second, first in a positivedirection and then in a negative direction. The charging process also exhibits the same exponential behaviour as the DISCHARGE . However this time the exponential curve approaches a constant asymptotic value rather than a zero value.
6 CHARGE AND DISCHARGE OF A CAPACITOR . THE exponential . The exponential voltage function, which is derived from equation (1), t V(t) Vo e - (2). is shown in Figure 3. It has a slope (rate of change) which is proportional to the value of the function (V) no matter where you are on the curve. Note that, in equation (2), when t = -, V(t) falls to 1/e =. of its original value (at t = 0). - is called the time constant for the exponential decay . The time to drop to 1/e of a previous value is constant, no matter where on the curve you take your "initial" value. Figure 3 illustrates the exponential decay for a discharging CAPACITOR , while Figure 4 illustrates the voltage change for a charging CAPACITOR .
7 In the latter case, the voltage increases, but still approaches a constant value; this is still exponential decay , but because the voltage starts from a lower value and then rises to its asymptotic value, an additional constant term is needed in the t - analogue to Equation (2). The full expression in this case is V(t) Vo (1 e ). In this experiment you will be observing repeated exponential curves; you can confirm whether the decay in voltage is exponential , and measure the time constant for that decay .. CAPACITOR Discharging CAPACITOR Charging Figure 3. Figure 4. CHARGE AND DISCHARGE OF A CAPACITOR . THE EXPERIMENT. Connect the signal generator in series with the resistor and CAPACITOR as shown in Figure 5.
8 Note: As with all electrical circuits, connect up the components of the circuit first, then introduce the measuring equipment (in this case the oscilloscope) only afterwards. Figure 5. Figure 6. Connecting the Y B and Y B channels of the oscilloscope as in Figure 5 will allow you to simultaneously observe the applied voltage from the signal generator (the square wave) with beam A of the dual trace oscilloscope, and the voltage across the CAPACITOR , VC , with beam B. The ground leads (black) of the coaxial cables, which should be connected to the ground output of the signal generator (also black), are denoted by G. The pairs of leads (G, YA) and (G, Y B) represent the coaxial cables leading to the oscilloscope.
9 Adjust the DC OFFSET of the generator so that the generator output alternates between a positive voltage and zero voltage. Use the manufacturer's values for C and R in your comparison of observation and theory. You may notice that the load placed on the signal generator by the circuit tends to distort the applied square wave; experiment with the output voltage of the signal generator to minimize this effect. Repeat your measurements for at least two different values for R C and thus for the time constant. POINTS TO CONSIDER: The data you take should test whether the voltage across the discharging CAPACITOR VC shows exponential behaviour Initially choose values of frequency f which allow the CAPACITOR to CHARGE or DISCHARGE fully in each period.
10 (The period of the signal from the signal generator T = 1/f should be several times the time constant -.) Try out a variety of values of the signal generator frequency and see what CHARGE AND DISCHARGE OF A CAPACITOR . it does to your display. Obtain a quick value for the time constant -, by measuring, on the oscilloscope screen, the time required for the voltage to fall towards the asymptotic value by a factor of 1/e. Use the oscilloscope to determine time and voltage values for particular values of R and C and record VC as a function of t. If you use the data creation and analysis program on the Faraday computer to analyze your results, note that the notation used for ln(x), the natural logarithm of x, is Log[x].