Transcription of pgfplots generates beautiful simple graphs
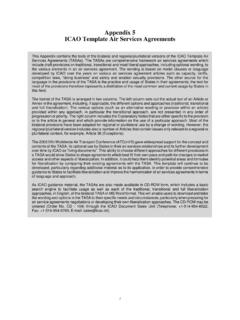
1 pgfplots generates beautiful simple graphsTony RobertsUniversity of 17, 2018 For research, lecture notes , tutorials, examinations, and online quizzes weoften need to simply generate high quality graphs . The LATEX packagepgfplots does a beautiful and flexible job such as the following. This documentconcisely summarises some useful basics of 2D pgfplots (3D is available butnot addressed here). 4 224 4 224xyfgf g1 Contents2 Contents1 Basic figure template22 Graph formulas33 Options44 Extras65 Further examples86 3D graphics117 matlab2tikz is powerful but requires care121 Basic figure templateEnable with\usepackage{ pgfplots }\pgfplotsset{co mpat=newest}in the preamble of any regular LATEX document.
2 I prefer to first draft agraph interactively using the application LaTeXiT. The general format fordrawing a figure (often within acenterenvironment) isfor a single curveuse\begin{tikzpicture}\begin{axis}[ axis-options]\addplot+ formula;\end{axis}\end{tikzpicture}for multiple curvesuse\begin{tikzpicture}Tony Roberts, May 17, 20182 Graph formulas3\begin{axis}[axis-options]\addp lot+[plot-options] formula;\addlegendentry{label}\addplot+[ plot-options] formula;\addlegendentry{label}..\end{axi s}\end{tikzpicture}2 Graph formulasfunction plotTo plot a curve where the vertical coordinate is a functionof the horizontal coordinate, just give the function formula in termsofxwithin braces.
3 For example\addplot+ {-4+x^2-x^4/32};Trigonometric functions assume degrees, so invoke assin(deg(x))forexample, and convert arc-functions as inatan(x)/deg(1).The + in\addplot+means that a different line style/colour is usedfor each successive plotFor a parametric plot give the horizontal and verticalformulas in terms of x within braces, comma separated, within paren-theses. For example, to ploty= 2x 4 one could do\addplot+ ({x^2/2+2},{x});given dataIn place offormula, usecoordinates{point-list}where thepoint-list has the form(x1,y1)(x2,y2)..(xn,yn)for the numericaldata point coordinates (no commas between the parentheses). Forexample, to draw the absolute value function one could\addplot+ coordinates{(-2,2)(0,0)(2,2)}Legend?
4 Specify\addlegendentry{..}immediately after the curve Roberts, May 17, 20183 Options4 Annotation?specifying\node at (axis cs:x1,y1) {text};annotatesa plot with the text centered at the location(x1,y1)in the plot coor-dinate examplethe following draws the figure shown at the start of thisdocument, and using some of the options explained next.\begin{tikzpicture}\begin{axis}[ xlabel={$x$}, ylabel={$y$},axis lines=middle,samples=41, grid, thick,domain=-4:4,legend pos=outer north east]\addplot+[no marks] {-4+x^2-x^4/32};\addlegendentry{$f$}\add plot+[no marks] {13/4-(x+1)^2/4};\addlegendentry{$g$}\ad dplot+[mark=*,mark repeat=5]{-4+(13/4-(x+1)^2/4)^2-(13/4-(x +1)^2/4)^4/32};\addlegendentry{$f\circ g$}\end{axis}\end{tikzpicture}3 OptionsThe options for the axis-options and the plot-options are largely the same:it is just that the plot-options override corresponding attributes set in options need to be comma separated, and may span many options are optional, but some are usual.
5 Axis lines=middlepgfplot graphics normally are boxed, but formany purposes we want axes through the origin, so often invoke Roberts, May 17, 20183 Options5 xlabel={$x$}defines horizontal axis label. ylabel={$y$}defines vertical axis label; sometimes useful for la-belling the plotted function as inylabel={$y=\sin x$}. title={..}defines a title to go across the top of the plot whennecessary. samples=41 The pgfplot default is to use a distressingly few pointsto approximate a curve; overriding it, to say 41, is common. smoothDraws a smooth curve between data points (is an alternativetosamples), especially useful for plots from specified coordinate points.
6 Thickspecifies the curves are drawn a bit thicker, which usuallyseems good to do. gridfor some plots we want a grid drawn. legend pos=..specifies the position of the legend in a multi-curvefigure: can be one ofouter north east(safely outside the plottedarea),north east,south east,north west,south west. domain=a:busually desirable and specifies the domain [a,b] for thevariablexin the formula; if not a parametric plot, then this will alsobe the horizontal extent of the plot. xmin=a, xmax=b, ymin=c, ymax=dany or all of these specify thehorizontal and vertical domains of the plot; any curve or data pointoutside these ranges are clipped out of the plot; needed sometimes.
7 Colour? To specify colour just write the corresponding word fromblue,red, brown, green, cyan, magenta, yellow, black, gray, white,darkgray, lightgray, lime, olive, orange, pink, purple, teal,violet. dashedplots the curve dashed; there is alsosolid,dotted,dashdottedanddashdotdot ted. no marksthe default is to mark every data point (even if a formulaiccurve); usually omit such Roberts, May 17, 20184 Extras6 Whereasonly marksomits the line joining the data points. mark=..to override the default mark; choose from*(discs),x,+,or more via\usetikzlibrary{plotmarks}in the preamble. mark repeat=ninstead of marking every data point, this marks everynth data point (starting with the first); sometimes useful with specifiednumber of samples.
8 Axis equal imagemake the axes of equal scaling, and trim widthor height to suit. small, footnotesize, tinyuse one of these to make the figuresmaller, or even smaller still, or (as it says) tiny, respectively. Youmay also want to includefont=\smallorfont=\footnotesizeto correspondingly change the size of any annotations. ybar interval,black,fill=pinkwill form a (vertical) bar plotwith black rectangles and filled with pink. Similarly forxbar interval. xtick={-2,..,8}will forcex-axis labels and grids to be drawn atevery integer between 2 and 8. Whereasxtick={a,c,..,b}putsx-axis labels and grids ata: :bwhere =c a. Analogously forytick. xticklabels={list}will label eachx-axis tick with specified infor-mation.
9 For example,xtick={1,3,4}andxticklabels={$a$ ,$x$,$b$}specifies three ticks at these locations but labels thema,xandbre-spectively. Analogously Extras \pgfplotsset{options}Sets global options so they do not have tobe repeated. For example, make all plots small by\pgfplotsset{small}. The functionrandgenerates a random number for each invocationin a function at each data point; the random numbers are uniformover [ 1,1].Tony Roberts, May 17, 20184 Extras7 Inequalities provide the step function: for example,(x> )is thefunction which is zero forx and one forx > . \node[pin=45:{$e$}] at (axis ,0) {};Put after an\addplot ..;annotates a plot with a pin and a marker at the givenlocation.
10 \node[circle,fill=blue,scale= ,pin=135:{$(3,24)$}] at (axis cs:3,24){};additionally draws a circular marker there as well. You can mix colours: for example,teal!50!whitegives a pale teal. Optionopacity=fraction makes something somewhat transparent; forexample,fill opacity= a fill 50% transparent. \addplot[..] {..} \closedcycle;is useful for shading regionsas it draws end-lines and fills-in down to the horizontal axis. hide y axisdoes precisely what it says. One can add explanatory text to a legend with\addlegendimage{empty legend}\addlegendentry[text width=9em,text depth=]{The quickbrown fox jumps over the lazy dog.}It is typeset ragged-right. Contours? Drawing contours is possible, but currently requires trickyinterfacing with external software.