Transcription of Introduction to visualising spatial data in R
1 Introduction to visualising spatial data in RRobin Lovelace James Cheshire, Rachel Oldroyd and for latest versionContentsPreface .. 1 Part I: Introduction2 Prerequisites .. 2R Packages .. 3 Part II: spatial data in R4 Starting the tutorial and downloading the data .. 4 The structure of spatial data in R .. 5 Basic plotting .. 6 Selecting quadrants .. 7 Part III: Creating and manipulating spatial data9 Creating new spatial data .. 9 Projections: setting and transforming CRS in R .. 10 Attribute joins .. 10 Clipping and spatial joins .. 12 Part IV: Making maps with tmap, ggplot2 and leaflet14tmap.. 14ggmap.. 15 Creating interactive maps withleaflet.. 16 Advanced Task: Faceting for Maps .. 18 Part V: Taking spatial data analysis in R further19 Acknowledgements20 References20 PrefaceThis tutorial is an Introduction to analysing spatial data in R, specifically through map-making with R s base graphics and various dedicated map-making packages for R includingtmapandleaflet.
2 It teachesthe basics of using R as a fast, user-friendly and extremely powerful command-line Geographic InformationSystem (GIS).The tutorial is practical in nature: you will load-in, visualise and manipulate spatial data. We assume noprior knowledge of spatial data analysis but some experience with R will help. If you have not used R before,it may be worth following an introductory tutorial, such asEfficient R Programming(Gillespie and Lovelace,2016), the official Introduction to R or tutorials suggested on and you know some R, it s time to turn your attention towards spatial data with R. To that end, this tutorialis organised as follows:1. Introduction : provides a guide to R s syntax and preparing for the tutorial12. spatial data in R: describes basic spatial functions in R3. Creating and manipulating spatial data: includes changing projection, clipping and spatial making withtmap,ggplot2andleaflet: this section demonstrates map making with moreadvanced visualisation tools5.
3 Taking spatial analysis in R further: a compilation of resources for furthering your skillsTo distinguish between prose and code, please be aware of the following typographic conventions used inthis document: R code ( (x, y)) is written in amonospacefont and package names ( )are written inbold. A double hash (##) at the start of a line of code indicates that this is output from outputs have been omitted from the document to save space, so do not be alarmed if R producesadditional messages: you can always look up them up with any programming language, there are often many ways to produce the same output in R. The codepresented in this document is not the only way to do things. We encourage you to play with the code togain a deeper understanding of R. Do not worry, you cannot break anything using R and all the input datacan be re-loaded if things do go wrong.
4 As with learning to skateboard, you learn by falling and getting anError:message in R is much less painful than falling onto concrete! We encourageError:s it means youare trying new I: IntroductionPrerequisitesFor this tutorial you need a copy of R. The latest version can be downloaded from also suggest that you use an R editor, such as RStudio, as this will improve the user-experience and helpwith the learning process. This can be downloaded from The R Studio interface iscomprised of a number of windows, the most important being the console window and the script you type directly into the console window will not be saved, so use the script window to createscripts which you can save for later use. There is also a Data Environment window which lists the dataframesand objects being used. Familiarise yourself with the R Studio interface before getting started on the writing code in any language, it is good practice to use consistent and clear conventions, and R isno exception.
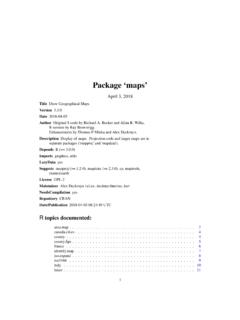
5 Adding comments to your code is also useful; make these meaningful so you remember whatthe code is doing when you revisit it at a later date. You can add a comment by using the#symbol beforeor after a line of code, as illustrated in the block of code below. This code should create Figure 1 if typedcorrectly into the Console window:Figure 1: Basic plot of x and y (right) and code used to generate the plot (right).This first line in this block of code creates a newobjectcalledxand assigns it to a range of integers between1 and 400. The second line creates another object calledywhich is assigned to a mathematical formula, andthe third line plots the two together to create the plot <-, the directional arrow assignment symbol which creates a new object and assigns it to the valueyou have you require help on any function, use thehelpcommand, (plot).
6 Because R users love beingconcise, this can also be written as?plot. Feel free to use it at any point you would like more detail on aspecific function (although R s help files are famously cryptic for the un-initiated). Help on more generalterms can be found using the??symbol. To test this, try typing??regression. For the most part,learningby doingis a good motto, so let s crack on and download some packages and PackagesR has a huge and growing number of spatial data packages. We recommend taking a quick browse on R smain website to see the spatial packages available: this tutorial we will use the following packages: ggmap: extends the plotting packageggplot2for maps rgdal: R s interface to the popular C/C++ spatial data processing library gdal rgeos: R s interface to the powerful vector processing library geos maptools: provides various mapping functions dplyrandtidyr: fast and concise data manipulation packages tmap: a new packages for rapidly creating beautiful mapsSome packages may already be installed on your computer.
7 To test if a package is installed, try to load itusing thelibraryfunction; for example, to test ifggplot2is installed, typelibrary(ggplot2)into theconsole window. If there is no output from R, this is good news: it means that the library has already beeninstalled on your you get an error message,you will need to install the package ("ggplot2"). Thepackage will download from the Comprehensive R Archive Network (CRAN); if you are prompted to select a mirror , select one that is close to current location. If you have not done so already, install these packages onyour computer now. A quick way to do this in one go is to enter the following lines of code:x <-c("ggmap", "rgdal", "rgeos", "maptools", "dplyr", "tidyr", "tmap")# (x) # warning: uncommenting this may take a number of minuteslapply(x, library, = TRUE)# load the required packages1 Tip: typingAlt -on the keyboard will create the arrow in RStudio.
8 The equals sign=also II: spatial data in RStarting the tutorial and downloading the dataNow that we have looked at R s basic syntax and installed the necessary packages,let s load some real spatialdata. The next part of the tutorial will focus on plotting and interrogating spatial data used for this tutorial can be downloaded from: Click on the Download ZIP button on the right hand side of the screenand once downloaded, unzip this to a new folder on your the existing Creating-maps-in-R project usingFile -> Open the top , use theproject menuto open the project or create a new one. It ishighly recommendedthatyou use RStudio s projects to organise your R work and that you organise your files into sub-folders ( ,input-data,figures) to avoid digital clutter (Figure 2). The RStudio website contains an overviewof the software: 2: The RStudio environment with the project tab poised to open the Creating-maps-in-R a project sets the current working directory to the project s parent folder, theCreating-maps-in-Rfolder in this case.
9 If you ever need to change your working directory, you can use the Session menu at thetop of the page or use first file we are going to load into R Studio is the london_sport shapefile located in the data folder ofthe project. It is worth looking at this input dataset in your file browser before opening it in R. You willnotice that there are several files named london_sport , all with different file extensions. This is because ashapefile is actually made up of a number of different files, such as .prj, .dbf and . could also try opening the file file in a conventional GIS such as QGIS to see what ashapefile should also open in a spreadsheet program such as LibreOffice Calc. to see what thisfile contains. Once you think you understand the input data, it s time to open it in R. There are a number ofways to do this, the most commonly used and versatile of which isreadOGR.
10 This function, from thergdalpackage, automatically extracts the information regarding the R s interface to the Geospatial Abstraction Library (GDAL) which is used by other open sourceGIS packages such as QGIS and enables R to handle a broader range of spatial data formats. If you ve notalreadyinstalledand loaded thergdalpackage (see the prerequisites and packages section) do so now:4library(rgdal)lnd <-readOGR(dsn = "data", layer = "london_sport")In the second line of code above thereadOGRfunction is used to load a shapefile and assign it to a new spatialobject called lnd ; short for afunctionwhich accepts twoarguments:dsnwhich standsfor data source name and specifies the directory in which the file is stored, andlayerwhich specifies thefile name (note that there is no need to include the file extention .shp).