Transcription of 1/2000 - Mason Technology
1 1/2000 . Information for users of METTLER TOLEDO thermal analysis systems Dear Customer, 11. The year 2000 should prove to be extremely interesting for METTLER TOLEDO thermal analysis. We plan to expand the very successful STARe product line with the introduction of an exciting new instrument for dynamic mechanical analysis. And of course the current thermal analysis instruments have been undergoing continuous development. In this edition of UserCom, we are delighted to present the new DSC822e. interpreting DSC curves Contents Part 1: Dynamic measurements TA TIP. interpreting DSC curves;. The art of interpreting curves has yet to be integrated into commercially available com- puter programs. The interpretation of a DSC measurement curve is therefore still some- Part 1: Dynamic measurements thing you have to do yourself. It requires a considerable amount of experience in thermal analysis as well as a knowledge of the possible reactions that your particular sample can NEW in our sales program undergo.
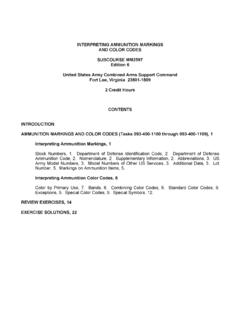
2 DSC822e This article presents tips and information that should help you with the systematic inter- pretation of DSC curves. Applications Recognizing artifacts The glass transition from the point of The first thing to do is to examine the curve for any obvious artifacts that could lead to a view of DSC measurements;. Part 2: Information for the character- possible misinterpretation of the results. Artifacts are effects that are not caused by the ization of materials sample under investigation. Figure 1 shows examples of a number of such artifacts. They include: Thermal values of fats: DSC analysis or dropping point determination? a) An abrupt change of the heat transfer between the sample and the pan: 1) Samples of irregular form can topple over in the pan. The use of MaxRes for the investiga- 2) Polymer films that have not been pressed against the base of the pan first change tion of partially hydrated Portland cement systems shape (no longer lie flat) on initial warming. Afterward, on melting, they make good contact with the pan (Fig.
3 2). Vitrification and devitrification b) An abrupt change of the heat transfer between the pan and the DSC sensor: phenomena in the dynamic curing of an epoxy resin with ADSC. 1) Distortion of a hermetically sealed Al pan due to the vapor pressure of the sample. 2) Slight shift of the Al pan during a dynamic temperature program due to different Expansion and shrinkage of fibers coefficients of expansion (Al: ~ 24 ppm/K, DSC sensor ~ 9 ppm/K, see also Fig. 2). This artifact does not occur with Pt pans (~ 8 ppm/K). Tips 3) The measuring cell suffers a mechanical shock: The pans jump around on the The cooling performance sensor and can move sideways if they do not have a central locating pin. of the DSC821e c) The entry of cool air into the measuring cell due to a poorly adjusted measuring cell lid leads to temperature fluctuations which cause a very noisy signal. d) Electrical effects: 1) Discharge of static electricity in a metallic part of the system, or power supply disturbances (spikes).
4 2) Radio emitters, mobile (cellular). phones and other sources of high frequency interference. e) A sudden change of room temperature, Fig. 1. DSC artifacts (details are given in the text): An artifact can very often be identified by repeat- through sunshine. ing the measurement with a new sample of the same substance and observing whether the effect oc- curs again either at the same place or at a different place on the curve. Exceptions to this are f and h, f) The lid of the pan bursts as a result of which can be very reproducible. increasing vapor pressure of the sample. This produces an endothermic peak with a height of mW to 100 mW depend- ing on the quantity of gas or vapor evolved. g) Intermittent (often periodic) closing of the hole in the lid of the pan due to droplets that condense or to samples that foam. h) Contamination of the sensors caused by residues of a sample from previous experiments. The thermal effects characteristic for this substance always occur at the same temperature.
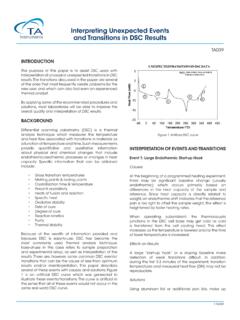
5 This problem can often be overcome by heating the system in air or oxygen. This type of artifact is very dependent on the contaminant. Artifacts caused by pans that are not inert also look very similar. Figure 3 shows an example of Fig. 2. Above: Artifact due to a PE film that was not pressed down firmly in the pan (dotted line). The this. sample of film that was pressed down on the base of the pan with the lid of a light Al pan gave the "correct" melting curve. Artifacts can also interfere with automatic Below: DSC heating curve of mg polystyrene showing a typical artifact at about 78 C caused by the thermal expansion of the Al pan. This artifact, which is of the order of 10 W, is only visible with evaluations (with EvalMacro), especially large scale expansion (ordinate scale < 1mW). those using automatic limits. Isolated artifacts that have been definitely reweighing after the analysis. The first for the first time to the final tempera- identified as such can be eliminated from measurement is often performed using a ture.
6 This freezes any possible meta- the measurement curve using TA/Baseline. pan with a pierced lid and nitrogen as a stable states. The sample is then purge gas. measured a second time. A very conve- Measurement conditions The first heating curve is usually nient way to shock cool the sample to You define the temperature range and the measured from room temperature to the room temperature is to use the auto- heating rate for the measurement based on desired final temperature at a heating matic sample robot. It deposits the hot your knowledge of the physical and chemi- rate of 20 K/min. sample on the cold aluminum turn- cal properties of the sample. Interpretation is often facilitated by table, which cools it down to room Choose a temperature range that is on measuring a cooling curve directly temperature within a few seconds. If you the large side. At a heating rate of 20 K/min, afterward. The cooling rate that can be do not have a sample robot, you can you do not in fact lose too much time if used depends on the cooling option wait until the sample has reached its the range measured is 100 K too large.
7 Installed in your system. final temperature and then remove the Further information on this can be It is a good idea to heat the sample a pan with tweezers and place it on a cold found in UserCom 3. second time. Differences between the aluminum surface (with a 2 mm Use a sample weight of about 5 mg for first and the second heating curves can diameter hole for the pin) or immerse it the first measurement. Make a note of be very informative. for about 10 seconds in liquid nitrogen. the total weight of the sample and pan Another helpful variation is to shock so that you can detect a loss of weight by cool the sample after it has been heated 2. UserCom 1/2000 . depends on the sample and the cooling rate. Many substances in fact solidify from the melt at fast cooling rates to a glassy amorphous state. This is the reason why no melting peak occurs on heating the same sample a second time. Some metastable crystal modifications crystallize only in the presence of certain solvents. the sample does not escape from the pan through evaporation, sublimation, or (chemical) decomposition , or does not undergo transformation.
8 Any sample lost by evaporation cannot of course condense in the sample pan on cooling because the purge gas has already removed it from the measuring cell . Melting, crystallization and Fig. 3. Below: In an open pan, water evaporates before the boiling point is reached. Middle: In a self- mesophase transitions generated atmosphere (50 m hole in the lid), the boiling point can be measured as the onset. The heat of fusion and the melting point Above: In a hermetically sealed pan (at constant volume), there is no boiling point. The DSC curve is can be determined from the melting curve. a straight line until the Al pan suddenly bursts at about 119 C. If the ordinate scale is expanded 20. times, an exothermic peak can be observed that is due to the reaction of aluminum with water (see With pure substances, where the low tem- the expanded section of the curve). perature side of the melting peak is almost a straight line (Fig. 4a), the melting point corresponds to the onset. Impure and poly- If no thermal effects occur solid-solid transitions and glass transitions.
9 Meric samples, whose melting curves are In this case your sample is inert in the tem- The onset temperatures of the melting pro- concave in shape, are characterized by the perature range used for the measurement cesses of nonpolymeric substances are, how- temperatures of their peak maxima (Fig. and you have only measured the (tempera- ever, independent of the heating rate. 4b and c). Partially crystalline polymers ture dependent) heat capacity. If several effects occur with significant loss give rise to very broad melting peaks be- An inert sample does not undergo any loss of weight (>30 g), you would of course cause of the size distribution of the crystal- of weight (except 30 g surface mois- like to assign the latter to a particular peak lites (Fig. 4c). ture). After opening the pan, it looks exactly - weight loss is usually an endothermic ef- Many organic compounds melt with de- the same as before the measurement. This fect due to the work of expansion resulting composition (exothermic or endothermic, can be confirmed with the aid of a micro- from the formation of gas.)
10 One method is to Figs. 4d and 4e). scope for reflected light. heat a new sample step by step through the An endothermic peak in a DSC heating If you are interested in cp values, you need individual peaks and determine the weight curve is a melting peak if a suitable blank curve. Check the plausibil- of the pan and contents at each stage (at the sample weight does not decrease ity of the results you obtain: values for cp METTLER TOLEDO we call this "off-line significantly over the course of the peak. are usually in the range to 5 Jg-1K-1. thermogravimetry"). The best way is to A number of substances exhibit a To make absolutely sure that no effects oc- measure a new sample in a TGA, ands use marked degree of sublimation around cur, extend the temperature range of the the same type of pan as for the DSC mea- the melting temperature. If hermetically measurement and measure larger samples. surement. sealed pans are used, the DSC curve is The shape of the DSC curve is usually very not affected by sublimation and evapo- If thermal effects are visible characteristic and helps to identify the na- ration.