Transcription of 1/3 Octave Frequency Chart - Robert Yates
1 1/3 Octave Frequency Chart Audio Octave Ranges Frequency Range When Used Produces This Effect When Used Too Much Produces This Effect 16Hz to 60 Hz Sense of power, felt more than heard makes music muddy 60Hz to 250Hz Fundamentals of rhythm section, EQing can change musical balance making it fat or thin makes music boomy 250Hz to 2 KHz Low order harmonics of most musical instruments telephone quality to music 500 to 1 KHz horn-like, 1K to 2 KHz tinny, listening fatigue 2 KHz to 4 KHz Speech Recognition 3 KHz listening fatigue, lisping quality, "m , "v", "b" indistinguishable 4 KHz to 6 KHz Clarity and definition of voices and instruments, makes music seem closer to listener, adding 6db at 5 KHz makes entire mix seem 3db louder sibilance on vocals 6 KHz to 16 KHz Brilliance and clarity of sounds sibilance, harshness on vocals Key Frequencies For Instruments Instrument Key Frequencies Bass Guitar Attack or pluck at 700 or 1 KHz; Bottom at 60 or 80Hz; string noise at Bass Drum Slap at ; Bottom at 60 or 80Hz Snare Drum Fatness at 240Hz; Crispness at 1 to ; Bottom at 60 or 80 Hz Hi-Hat and Cymbals Shimmer at to 10 KHz; Klang or gong sound at about 200Hz Toms Attach at 5 KHz; Fullness at 240Hz Floor Toms Attach at 5 KHz; Fullness at 80 or 240Hz Electric Guitar Body at 240Hz; Clarity at Acoustic Guitar Body at 240Hz; Clarity at ; Bottom at 80 or 120Hz piano Bass at 80 or 120Hz; Presence at to 5 KHz; Crispness at 10 KHz; Honky-tonk sound at as bandwidth is narrowed; Resonance at 40 to 60Hz Horns Fullness at 120 or 240Hz; Shrill at or 5 KHz Voice Fullness at 120Hz; Boominess at 200 to 240Hz; Presence at 5 KHz.
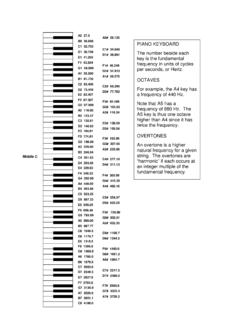
2 Sibilance at ; Air at 12 to 15 KHz Harmonica Fat at 240Hz, bite at 3 to 5 KHz Conga Resonant ring at 200 to 240Hz; Presence and slap at 5 KHz ~ The Fundamental Frequencies (Pitch) of Notes piano keyboard The number beside each key is the fundamental Frequency in units of cycles per seconds, or Hertz. OCTAVES For example, the A4 key has a Frequency of 440 Hz. Note that A5 has a Frequency of 880 Hz. The A5 key is thus one Octave higher than A4 since it has twice the Frequency . OVERTONES An overtone is a higher natural Frequency for a given string. The overtones are "harmonic" if each occurs at an integer multiple of the fundamental Frequency . A note played on an instrument, such as middle C played on a piano , is not made up of just one Frequency , but is complex and made up of many frequencies that combine to give the sound we hear.
3 The first or predominant Frequency we hear is called the fundamental Frequency . Additional frequencies that make up that note are referred to as harmonics. Here is an example of Middle C and it s initial Middle C C4 262 Hz - Fundamental C5 523 Hz -first harmonic, ( Octave ) G5 785 Hz -second harmonic, (fifth) C6 1046 Hz third harmonic, ( Octave ) E6 1318 Hz fourth harmonic, (third) G6 1568 Hz fifth harmonic, (fifth) Bb6 1865 Hz sixth harmonic, (dominant seventh) C7 2093 Hz seventh harmonic, ( Octave ) A harmonic is one of a series of sonic components of a sound. A sounding pitch comprises a fundamental, and a number of harmonics above that fundamental, the totality being called a harmonic spectrum or harmonic series. The make-up of a spectrum (which harmonics are present, and in what proportion) produces the timbre, or tone color, of an instrument or voice.
4 The relative amplitudes (loudness) of the various harmonics primarily determine the timbre of different instruments and sounds. Some sounds, such as a cymbal or gong, are more complex in it s harmonic makeup and include overtones which are not harmonics(non-harmonics are frequencies that are not integer multiples of a fundamental Frequency ). Because of this, a fundamental Frequency is harder to determine; that's why the gong's sound doesn't seem to have a very definite pitch compared to the same fundamental note played on a piano . (music) YOUR BAND IS JUST WAY TOO LOUD!! Are you sure about that? Maybe we re just too harsh or loud in some frequencies! I ve heard bands that were just as loud if not louder than another band, but were more tolerable to listen to due to their overall sound you ? Try this, put your ear next to someone playing a bass guitar at a certain decibel level, and then do the same thing with someone banging a cymbal.
5 You should perceive the cymbal as being louder . This is because humans don't hear all frequencies of sound at the same level. That is, our ears are more sensitive to some frequencies and less sensitive to other frequencies. Not only that, but the sensitivity changes with the sound pressure level (SPL), too. This is called the Fletcher Munson Equal Loudness Curve and if you are a sound engineer or work with sound, it is something you need to be aware of. Take a look at the Chart below. You'll notice it's marked horizontally with a scale denoting the Frequency of sound. Vertically it's marked in SPL. On the Chart are a number of curved lines, each with a number (loudness level) marked. Let's begin by looking at the lowest solid line marked with a loudness level of 10 phons. (The loudness level in phons is a subjective sensation--this is the level we perceive the sound to be at.)
6 From about 500Hz to roughly 1,500Hz the line is flat at 10dB SPL on the graph. This means that for us to perceive a sound to be at a loudness level (LL) of 10 phons, frequencies from 500Hz to 1,500 Hz must be at 10dB. Make sense so far? OK, now look further into the higher frequencies, say 5,000Hz. Notice the line dips here--this says we perceive 5,000Hz to be 10 phons when the source is actually only 6dB. To perceive 10,000Hz at the same level (10 phons), it would need to be about 20dB. From this we can clearly see the ear is more sensitive in the 2,000Hz to 5,000Hz range, yet not nearly as sensitive in the 6,000Hz and up range. Just How Loud Is LOUD?? Here are some interesting numbers, collected from a variety of sources that help one to understand the volume levels of various sources and how they can affect our hearing.
7 Environmental Noise Weakest sound heard 0dB Normal conversation (3-5') 60-70dB Telephone dial tone 80dB City Traffic (inside car) 85dB Train whistle at 500' 90dB Subway train at 200' 95dB Level at which sustained exposure may result in hearing loss 90 - 95dB Power mower 107dB Power saw 110dB Pain begins 125dB Pneumatic riveter at 4' 125dB Jet engine at 100' 140dB Death of hearing tissue 180dB Loudest sound possible 194dB Perceptions of Increases in Decibel Level Imperceptible Change 1dB Barely Perceptible Change 3dB Clearly Noticeable Change 5dB About Twice as Loud 10dB About Four Times as Loud 20dB Sound Levels of Music Normal piano practice 60 -70dB Fortissimo Singer, 3' 70dB Chamber music, small auditorium 75 - 85dB piano Fortissimo 84 - 103dB Walkman on 5/10 94dB Symphonic music peak 120 - 137dB Amplifier rock, 4-6' 120dB Rock music peak 150dB Just What is a Decibel (db)?
8 Early acousticians came up with a simple method of comparing two sounds. A sound that was perceived to be twice as loud as another was said to be one Bel greater in sound level. The Bel was used as a unit of comparison. It is not a unit of measure. Its namesake, Alexander Grahm Bell, was a pioneer in the science of audiology (the study of human hearing). It soon became apparent this unit of comparison was not very useful in describing the difference between similar sounds. A small unit of comparison, the decibel, was established. One decibel (1 dB) is one-tenth of a Bel. Since a decibel is one-tenth of a Bel, then 10 decibels (10 dB) would equal one Bel. In other words, a sound that is twice as loud as another sound could be described as being 10 decibels (10 dB) louder. By definition, one decibel (1 dB) represents the smallest change in volume a human ear can perceive.
9 The average ear, however, can only detect a 3 dB change. EQ The three main types of EQ are: Shelving, Graphic, and Parametric SHELVING o Found in most mixers (including Ramsa and Mackie) o "Bass" (LF) and "Treble" (HF) controls boost or cut begining at a certain point ("knee") o Sometimes midrange (MF) is included, and sometimes with adjustable midpoint Frequency GRAPHIC o Octave , 1/2 Octave and 1/3 Octave varitites o Separate boost/cut adjustment (usually a slide pot) for each band o Display of slide pots in a row shows a "graphic" picture of EQ PARAMETRIC o Separate adjustment of Boost/Cut, Center Frequency , and Q (sharpness of peak/dip)