Transcription of 1 Creating Multiple Baseline (MB) Single-Subject Design ...
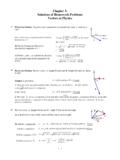
1 1 Creating Multiple Baseline (MB) Single-Subject Design Graphs in Microsoft Excel 2007 2 Step 1: Set up the Variables Multiple Baseline Design (MB) X-axis 1st AB 2nd AB 3rd AB Use the top cells to Label the variables that will be displayed on X and Y-Axes of the graph Each Baseline across behaviors, settings, or subjects and the IV is set up as separate AB Design in the same worksheet 3 Step 1: Set up the Variables X-Axis for Multiple Baseline Design X-Axis Label Enter X-axis label in this cell For example: If you are graphing data for each day enter, Date in this cell If you are graphing data for each trial, enter Trial in this cell If you are graphing data for each session, enter sessions 4 Step 1: Set up the Variables X-Axis 5 Step 1: Set up the CONDITION LABELS SDC Baseline and DRA Yard Baseline and DRA Yard Baseline and DRA 1.
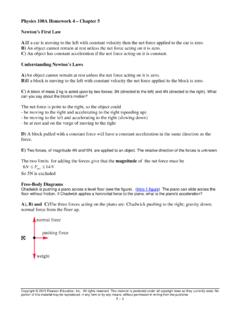
2 This setup is MB Design across settings (SDC, Yard and Gen Ed.) 2. MB across subjects and behaviors should be set up in similar ways 6 Step 1: For Variables Across behaviors This setup is MB Design across behaviors (Aggression and leaving the classroom) 7 Step 2: Enter the data X-Axis 8 Step 2: Enter the Data Y-Axis ( Multiple Baseline Design ) This example represents the data entry for MB across 3 settings 9 Creating the Line Graphs 10 Step: 3 Create the Line graph for the First AB Design We need to create 3 separate AB graphs and then combine them together First: You want to make sure that the first AB line graph you create will contain the most data points (in this case, the AB line graph for GEN EDU class).
3 Position the mouse on cell A2 Click and hold the left mouse button Move the mouse till all the cells till the end of DRA are highlighted (stop at C26) Release the left button Most data points Second most data points Least data points 11 Step 3: Create the Line graph for the first AB Design Click on Insert Line Chose the circled line graph above 12 Step 3: Create the Line graph for the first AB Design You now have your first line graph and you can begin editing the chart 13 Step 4: Formatting the first line graph Begin by deleting the legend (right click and push delete) 14 Step 4: Formatting the First line graph Select the first data series ( Baseline ) by clicking on one of the data points (first line graph ) Then go to Format and select Shape Outline to change the color to black (see above) Format Shape outline 15 Step 4: Formatting First Line graph Then go to Shape Fill to make the data points black Repeat these steps for the other data series 16 Step 4: Formatting First line graph Now, click anywhere on the graph and go to Format.
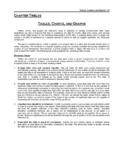
4 On the left where it says Plot Area, select Series 1 17 Step 4: formatting first Line graph Then go to Format Selection and click on it until the following window appears 18 Step 4: Formatting First line graph Select Marker Options, then select Built-in and choose the circle (marker size = aprox. 7-9) Repeat the steps for the other data series 19 Step 4: formatting the First line graph Then select Marker Line Color and select Gradient Line. Make sure to select the color WHITE Repeat the steps for the other data series 20 Step 4: Formatting First Line graph Since the first line graph will be our bottom graph , we can label the X-Axis. First, select Layout Second, select Axis Titles and select Primary Horizontal Axis Title, and then choose Title Below Axis 21 Step 4: formatting First line graph Click inside the box and title the X-Axis 22 Step 5: Adjusting the X-Axis We can now change the format of the X-Axis Click on Layout Primary Horizontal X-Axis And More Primary Horizontal X Options 23 Step 5: Adjusting the X-Axis Make sure of the following: Minimum = Fixed Maximum = Fixed Major Unit = 5 (reduces clutter on X-axis) Minor Unit = 1 Major Tick Mark = None Minor Tick Mark = Outside Click Close 24 Step 6.
5 Adjusting the Y-Axis Now we can change the format of the Y-Axis Click on Layout Primary Vertical Y-Axis And More Primary Vertical Y Options 25 Step 6: Adjusting the Y-Axis Click on Fixed and change minimum to -1 (if you have a 0 data point you want to make sure that the 0 does not fall on the X-Axis) Click Fixed and change Maximum to about 2 times the highest number in the data set. Except when Y-axis is a percentage. When Y represents Maximum = 100 Click on Fixed and change Major and Minor Unit to a whole number Change Horizontal Axis Crosses to -1 26 Step 7: Moving First Line graph to the Bottom Left click at the arrow and drag the first graph to the bottom 27 Step: 8 Creating the Second AB graph Position the mouse on cell D2 Click and hold the left mouse button Move the mouse and highlight all the cells until E26 (end of your first line graph intervention data) Release the left button 28 Step: 8 Creating the Second Line graph Follow steps 3-7 from the previous graph , but with two exceptions.
6 First, do not label the X-axis Second, Interval Between Tick Marks = 1 AND, AXIS Labels = None 1 29 Step 9: Creating the Third Line graph Position the mouse on cell F2 Click and hold the left mouse button Move the mouse and highlight all the cells until G26 (end of your first line graph intervention data) Release the left button 30 Step 9: Creating the Third Line graph Follow steps 3-7 from the previous graph , but with two exceptions: First, do not label the X-axis Second, Interval Between Tick Marks =1 AND, AXIS Labels= None (same instructions as the 2nd graph ) Align the graph so that the last point in the intervention phase of graph one is on the same line as the last point of the Baseline phase in graph 2 31 Step 10: Creating Chart Title Click inside the top graph Click on Layout Go to Chart Title Chose Above the Chart and label the title by clicking inside the box 32 Step 11: Eliminating Grid and Chart Border Lines We now need to eliminate the gridlines from each graph .
7 First, click anywhere on the graph and select Layout. Second, select Gridlines, then select Primary Horizontal Gridlines and select None Repeat these steps for the other 2 graphs 33 Step 11: Eliminating Grid and Chart Border Lines Right click on the left side of 10 Click on Format Chart Area (bottom of first pop up box) Click on Border Color and click No Line 34 Step 12: Drawing Phase Change Lines Click on Insert and then Shapes and choose the straight line First, hold down the shift key to ensure that the line remains straight Next, hold the left side of the mouse and move upward so that you are separating the Baseline from the intervention phase Continue this line so that it continues into the second AB graph (see next slide) Hint: You can also left click on the line and move it with the arrow keys 35 Step 12: Drawing phase Lines 36 Step 12: Drawing phase Lines: Draw horizontal lines to connect phase change lines 37 Step 11.
8 Changing the Format of the Phase Change Lines Right click on the first intervention line Click on format shape (at the bottom of the first pop up box) Click on line style (2nd pop up box) Click on the dashed line Repeat for all remaining lines Note: If you need to change these lines to black, click on Line Color and change to black Short cut: If you want to change all the lines at once, left click on your fist line and then hold down shift as you highlight the remaining lines 38 Step 12: Label the Phases and the Y-Axis 39 Step 12: Label the Phases and the Y-Axis Click on insert Click on draw text box Type the Name of the Phase ( Baseline and Intervention DRA) Right click on the border of the text box and go to Format Text box Click on Fill (no color) and Line (no color) We also need to label the setting where the DRA was implemented in this case Gen.
9 Ed class, Yard & SDC class Finally, we need to label the Y-axis by drawing a text box and then rotating the box (little green dot that appears when you click inside the text box) so that that the title is rotated vertically Example on next slide 40 Step 12: Label the Phases and the Y-Axis 41 Step 13: Covering the -1 on the Y-Axis You want to hide the -1 by completing the following steps: Click on Insert Click on Text Box Draw a small box around the -1 42 Step 13: covering the -1 on the Y-Axis Right click on the border of the box and then click on Format Shape (at the bottom of the pop up box) Click on fill color and select white Click on line color and select no fill Click on Close 43