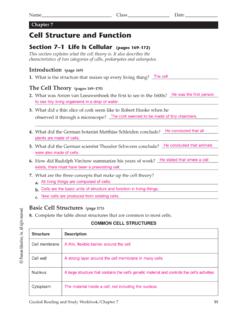
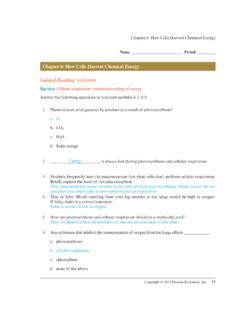
Transcription of 1.The graph below represents a change in event A that ...
1 1. The graph below represents a change in event A that leads to changes in events B and C. Which row in the chart best identifies each event in the graph ? A) 1 B) 2 C) 3 D) 4. 2. A fundamental concept of ecology is that living organisms A) are independent and do not interact with each other or with the physical environment. B) do not interact with other living organisms , but do interact with the physical environment C) interact with each other, but do not interact with the physical environment D) interact with other living organisms and interact with the physical environment 3. Base your answer to the following question on the diagram below and on your knowledge of biology. The diagram represents a food web in an ecosystem. Which row in the chart below best identifies the relationships between the mice and the wheat? A) 1 B) 2 C) 3 D) 4. 4. The chart below shows three ecological terms used to describe levels of organization on Earth. Which diagram best represents the relationship of these ecological terms?
2 A) B). C) D). 5. A stable ecosystem is characterized by having 7. Populations of aspen trees in the western United States are being destroyed by an unexplained illness. A) predators that outnumber their prey The altered landscape is affecting the animals that B) a continual input of energy live there. Populations of deer mice are increasing C) limited autotrophic nutrition greatly in these areas. Unfortunately, these mice often D) no competition between species carry a virus that is deadly to humans. This scenario 6. All of Earth's water, land, and atmosphere within best illustrates that which life exists is known as A) a change in the environment always results in A) a population B) a community disease C) a biome D) the biosphere B) humans are the cause of the breakdown of this ecosystem C) the stability of this ecosystem is limited by the amount of water available D) every population in an ecosystem is linked with other populations 8. Which statement describes a situation that would reduce the stability of a forest ecosystem?
3 A) A fierce predator is removed from the ecosystem. B) The number of producers remains constant in the ecosystem. C) organisms frequently interact within the ecosystem. D) The energy in the ecosystem flows from the Sun. 9. The organisms in a pond and the physical factors 12. Which statement most accurately predicts what influencing them best describe would happen in the aquarium shown below if it were tightly covered and maintained in natural light A) a population B) an ecosystem for one month? C) a biosphere D) a food chain 10. Due to overfishing, the number of fish in the ocean could drastically decrease. This will cause A) an increase in the stability of the oceans B) an increase in the salt content of the oceans C) a decrease in the stability of the oceans D) a decrease in the oxygen available in the oceans 11. The diagram below represents many species of plants and animals and their surroundings. A) The water temperature would rapidly decrease. B) The process of respiration in the snail would decrease.
4 C) The rate of reproduction of the fish would be affected. D) The organisms would probably survive because materials would cycle. 13. Which ecological term includes everything represented in the illustration below ? What does the diagram best represent ? A) a population B) a community C) an ecosystem D) the biosphere A) community B) ecosystem C) population D) species 14. Which factor is not necessary for an ecosystem to be self-sustaining? A) a constant source of energy B) living systems that incorporate energy into organic molecules C) a cycling of materials between organisms and their environment D) an equal number of producers and consumers 15. The Mississippi River Delta wetlands ecosystem is home to a large number of fish, birds, and other aquatic organisms . During the last century, this ecosystem has seen a decrease in wetland areas and species diversity due to land development, agriculture, and flooding. Conservation groups have been working to reconnect the Mississippi River with its flood plain and restore lost wetlands.
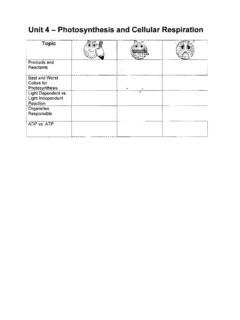
5 One result of restoring wetland areas in this ecosystem would be A) an increase in a biotic factors that would cause organisms to develop new adaptations B) the development of an ecosystem that will prevent invasive species from settling there C) an increase in the carrying capacity of the ecosystem for wetland organisms D) to prevent the organisms that live in this ecosystem from competing for food and shelter 16. As it grows from a seed to a mature plant, a plant will grow taller and thicker. Which are abiotic factors most responsible for the increase in the mass of the plant? A) water, minerals, bacteria B) sunlight, oxygen, plant receptors C) minerals, water, plant enzymes D) water, sunlight, carbon dioxide 17. A finite resource in the environment that keeps a population from steadily increasing is known as A) dynamic equilibrium B) a limiting factor C) a reproductive enzyme D) ecological successsion 18. Base your answer to the following question on the information below and on your knowledge of biology.
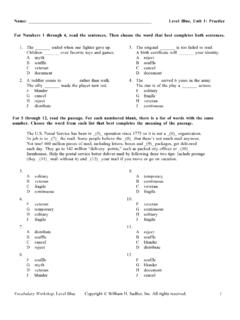
6 The graph below shows the growth of Paramecium aurelia in the same culture dish for 14. days. In another experiment, a second species of paramecium was introduced into a culture dish with Paramecium aurelia. Which statement describes a possible result as the populations interact over the next 14 days? A) The population numbers of Paramecium aurelia would be lower than 250, since the new species is competing with it for resources. B) The population of Paramecium aurelia would increase above 250, since they would mate with the new species. C) The population of Paramecium aurelia would increase above 250, since the two species occupy the same niche. D) The population of Paramecium aurelia would remain at 250, since the species compete with each other for the same resources. 19. The graph below shows the size of a population of foxes over a period of years. If the line did not stay around the carrying capacity, but continued to rise, which concept would this graph best illustrate?
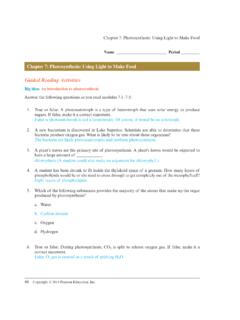
7 A) environmental stability B) genetic variety C) behavioral change D) overproduction Base your answers to questions 20 and 21 on the graph below and on your knowledge of biology. The graph shows the growth of a population of rabbits in a specific ecosystem. 20. Over a period of time, the location of the dashed line would move from location B to location C on this graph if A) the birthrate of the rabbit population was equal to the death rate of the rabbit population B) there was a decrease in the number of rabbit predators and an increase in the availability of plants C) there was a decrease in the availability of minerals, water, and shelter D) the entire rabbit population rnigrated to a new ecosystem containing more autotrophs 21. Which environmental factor could have caused the change indicated at A? A) increased predation by herbivores B) increased availability of food C) increased number of decomposers D) increased competition among carnivores 22. The increase of certain types of gases in the atmosphere has contributed to the problem of global warming.
8 All these gases are A) biotic factors B) abiotic factors C) organic factors D) endangered factors 23. Which process will result in a gain of energy in an ecosystem? A) photosynthesis in algae cells B) digestion in hummingbirds C) ATP synthesis in fungi D) respiration in maple tree cells 24. A study was done on three different fish species 27. What is the carrying capacity for herbivores in a living in a pond in New York State. The influence of habitat most directly affected by? temperature on the growth rates of the fish A) heat energy released by carnivores populations is shown in the graph below . B) carbon dioxide in the atmosphere C) photosynthetic organisms D) decomposers in the soil 28. Abiotic factors that could affect the stability of an ecosystem could include A) hurricanes, packs of wolves, and temperature B) blizzards, heat waves, and swarms of grasshoppers C) droughts, floods, and heat waves D) species of fish, number of decomposers, and supply of algae 29.
9 One biotic factor that affects consumers in an ocean In this pond where these fish live, temperature is a ecosystem is A) limiting factor A) number of autotrophs B) hereditary factor B) temperature variation C) source of ATP C) salt content D) source of solar energy D) pH of water 25. A scientist was studying a population of fish in a 30. The chart below shows the environmental functions pond over a period of 10 years. He observed that the that some organisms perform in a stable ecosystem. population increased each year for 3 years, and then remained nearly constant for the rest of the study. The best explanation for this observation is that the population had A) stopped reproducing B) reached carrying capacity C) mutated into a different species D) run out of food and migrated to a different pond 26. Which statement best describes bat populations in a stable ecosystem? How would a decrease in the number of organisms A) They are held in check by environmental that perform these functions most likely affect the factors.
10 Ecosystem? B) They are producers that rely indirectly on other producers. A) The interactions between other organisms would stop immediately. C) They are not limited by natural predators. B) The functions carried out by these organisms D) They are not dependent on other species. would no longer be necessary. C) The ecosystem would remain stable. D) The ecosystem would become less stable. 31. Information relating to an ecosystem is contained in the diagram shown below . Which information belongs in areas X and Y? A) X biotic factors; Y abiotic factors B) X ecological relationships; Y biotic relationships C) X abiotic factors; Y interacting populations D) X energy flow; Y biotic factors 32. An important abiotic factor affecting a shrub 34. Which statement regarding the ecosystem shown in community is the the diagram below is correct? A) type of shrub species present B) amount of annual rainfall C) number of predatory animals present D) availability of autotrophic organisms 33.