Transcription of 1015 18th St. NW, Suite 704 DEATH PENALTY …
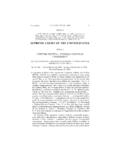
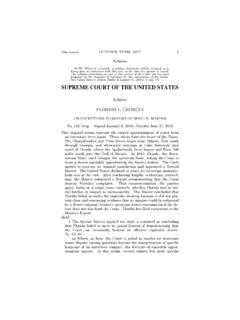
1 1928353943434652374253605965716685986874 455631383114 DEATH PENALTY INFORMATION CENTER Facts about the DEATH PENALTY 1015 18th St. NW, Suite 704 Washington, DC 20036 @DPInfoCtr Updated: December 7, 2016 NUMBER OF EXECUTIONS SINCE 1976: 1441 2316112518182152102010 76 77 78 79 80 81 82 83 84 85 86 87 88 89 90 91 92 93 94 95 96 97 98 99 00 01 02 03 04 05 06 07 08 09 10 11 12 13 14'15 '16 Other: 23 generally are white. Virginia Wyoming Gov t (19) Alaska Hawaii Illinois Iowa Maine Maryland Michigan Minnesota New York Vermont WisconsinOther White: 803 Black: 496 Over 75% of the murder victims in cases Hispanic.
2 119resulting in an execution were white, even though nationally only 50% of murder victims RACE OF DEFENDANTS EXECUTED RACE OF VICTIMS IN DEATH PENALTY CASES DEATH PENALTY STATES (31) Alabama Arizona Arkansas California Colorado Florida Georgia Idaho Indiana Kansas Kentucky Louisiana Mississippi Missouri Montana Nebraska Nevada New Hampshire North Carolina Ohio Oklahoma Oregon Pennsylvania South Carolina South Dakota Tennessee Texas Utah Washington Military NON- DEATH PENALTY STATES Connecticut Delaware** Massachusetts New Jersey New Mexico** North Dakota Rhode Island West Virginia District of Columbia **Inmates remain on DEATH row.
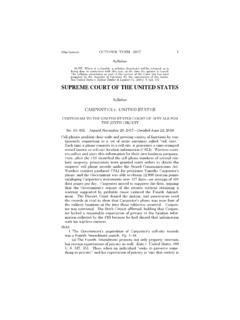
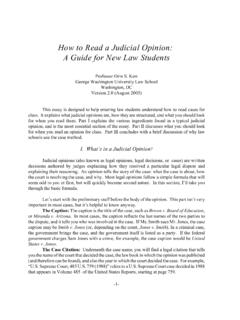
3 RECENT STUDIES ON RACE Jurors in Washington state are three times more likely to recommend a DEATH sentence for a black defendant than for a white defendant in a similar case. (Prof. K. Beckett, Univ. of Washington, 2014). Persons Executed for Interracial Murders 28220 In Louisiana, the odds of a DEATH sentence were 97% higher for those whose victim was white than for those whose victim was black. (Pierce & Radelet, Louisiana Law Review, 2011). A study in California found that those who killed whites were over 3 times more likely to be sentenced to DEATH than those who killed blacks and over 4 times more likely than those who killed Latinos.
4 (Pierce & Radelet, Santa Clara Law Review, 2005). A comprehensive study of the DEATH PENALTY in North Carolina found that the odds of receiving a DEATH sentence rose by times among those defendants whose victims were white. (Prof. Jack Boger and Dr. Isaac Unah, University of North Carolina, 2001). White Black In 96% of states where there have been reviews of race and the DEATH PENALTY , there was a pattern of Black Victim White Victim either race-of-victim or race-of-defendant discrimination, or both. (Prof. Baldus report to the ABA, 1998). FL IL TX LA OK AZ NC OH AL GA PA MO MS NM CA MA TN IN SC ID KY MD NE NV VA WA 1111111223334446669991010132026 Since 1973, more than 150 people have been released from DEATH row with evidence of their innocence.
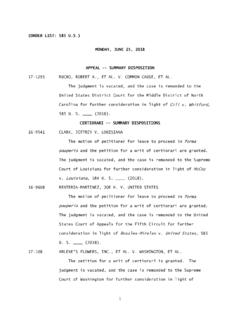
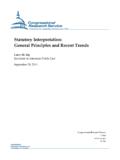
5 (Staff Report, House Judiciary Subcommittee on Civil & Constitutional Rights, 1993, with updates from DPIC). From 1973-1999, there was an average of 3 exonerations per year. From 2000-2011, there was an average of 5 exonerations per year. INNOCENCE DEATH Row Exonerations By State Total: 156 Other 3%Hispanic 13%Black 42%White 42%Race of DEATH Row Inmates and DEATH Row Inmates by State Source: NAACP Legal Defense Fund, DEATH Row USA (July 1, 2016). When added, the total number of DEATH row inmates by state is slightly higher than the given total because some prisoners are sentenced to DEATH in more than one state.
6 California 741 Mississippi 48 Idaho 9 Florida 396 Oklahoma 47 Utah Texas 254 S. Carolina 43 Washington Alabama 194 Arkansas 36 Virginia Pennsylvania 175 Kentucky 34 Military N. Carolina 155 Oregon 34 Colorado Ohio 142 Missouri 26 S. Dakota Arizona 126 Delaware 18 Montana Nevada 80 Indiana 12 New Mexico Louisiana 77 Kansas 10 N. Hampshire Tennessee 69 Nebraska 10 Wyoming Georgia 68 TOTAL: 2,905 Gov t 62 DEATH ROW INMATES BY STATE: July 1, 2016 DEATH ROW INMATES BY RACE 9 9 7 6 3 3 2 2 1 1 EXECUTIONS BY REGION* State Tot 2015 2016 State Tot 2015 2016 State Tot 2015 2016 TX 538 13 7 AR 27 0 0 PA 3 0 0 OK 112 1 0 MS 21 0 0 KY 3 0 0 VA 111 1 0 IN 20 0 0 MT 3 0 0 FL 92 2 1 DE 16 0 0 US GOVT 3 0 0 MO 87 6 1 CA 13 0 0 ID 3 0 0 GA 69 5 9 IL 12 0 0 SD 3 0 0 AL 57 0 1 NV 12 0 0 OR 2 0 0 OH 53 0 0 UT 7 0 0 NM 1 0 0 NC 43 0 0 TN 6 0 0 CO 1 0 0 SC 43 0 0 MD 5 0 0 WY 1 0 0 AZ 37 0 0 WA 5 0 0 CT 1 0 0 LA 28 0 0 NE 3 0 0 EXECUTIONS BY STATE SINCE 1976 South Midwest West Northeast TX & OK 6504851781174*Federal executions are
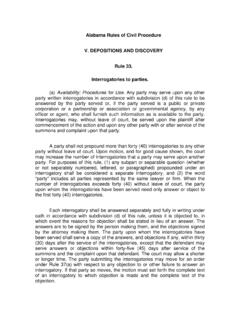
7 Listed in the region in which the crime was committed. DEATH SENTENCING The number of DEATH sentences per year has dropped dramatically since 1999. Year 1998 1999 2000 2001 2002 2003 2004 2005 2006 2007 2008 2009 2010 2011 2012 2013 2014 2015 Sentences 295 279 223 153 166 151 138 140 123 126 120 118 114 85 82 83 73 49 MENTAL DISABILITIES Source: Bureau of Justice Statistics: Capital Punishment, 2013. 2014 figure from DPIC research. Intellectual Disabilities: In 2002, the Supreme Court held in Atkins v. Virginia that it is unconstitutional to execute defendants with 'mental retardation.' Mental Illness: The American Psychiatric Association, the American Psychological Association, the National Alliance for the Mentally Ill, and the American Bar Association have endorsed resolutions calling for an exemption of the severely mentally ill.
8 A report by the National Research Council, titled Deterrence and the DEATH PENALTY , stated that studies claiming that the DEATH PENALTY has a deterrent effect on murder rates are fundamentally flawed and should not be used when making policy decisions (2012). Consistent with previous years, the 2014 FBI Uniform Crime Report showed that the South had the highest murder rate. The South accounts for over 80% of executions. The Yes 5%No Opinion 7%No 88% According to a survey of the former and present presidents of the country s top academic criminological societies, 88% of these experts rejected the notion that the DEATH PENALTY acts as a deterrent to murder.
9 (Radelet & Lacock, 2009) EXECUTIONS SINCE 1976 BY METHOD USED DETERRENCE Do executions lower homicide rates? Northeast, which has less than 1% of all executions, had lowest murder rate. Rates per 100,000 (2014) South Midwest West Northeast Nat l 1266 Lethal Injection 158 Electrocution 11 Gas Chamber 3 Hanging 3 Firing Squad JUVENILES 34 states plus the US government use lethal injection as their primary method. Some states utilizing lethal injection have other methods available as backups. Though New Mexico and Connecticut have abolished the DEATH PENALTY , their laws were not retroactive, leaving prisoners on the states DEATH rows and their lethal injection protocols intact.
10 In 2005, the Supreme Court in Roper v. Simmons struck down the DEATH PENALTY for juveniles. 22 defendants had been executed for crimes committed as juveniles since 1976. WOMEN There were 56 women on DEATH row as of Dec. 31, 2014. This constitutes less than 2% of the total DEATH row population. (NAACP Legal Defense Fund, Jan. 1, 2015). 16 women have been executed since 1976. FINANCIAL FACTS ABOUT THE DEATH PENALTY Defense costs for DEATH PENALTY trials in Kansas averaged about $400,000 per case, compared to $100,000 per case when the DEATH PENALTY was not sought. (Kansas judicial Council, 2014).