Transcription of 11 June/Juin 2021 COMMUNIQUE - NATO
1 11 June/Juin 2021 COMMUNIQUE . PR/CP(2021)094. Defence Expenditure of nato Countries (2014-2021). nato collects defence expenditure data from Allies and publishes it on a regular basis. Each Ally's Ministry of Defence reports current and estimated future defence expenditure according to an agreed definition of defence expenditure. The amounts represent payments by a national government actually made, or to be made, during the course of the fiscal year to meet the needs of its armed forces, those of Allies or of the Alliance. In the figures and tables that follow, nato also uses economic and demographic information available from the Directorate-General for Economic and Financial Affairs of the European Commission (DG ECFIN), and the organisation for Economic Co-operation and Development (OECD). In view of differences between these sources and national GDP forecasts, and also the definition of nato defence expenditure and national definitions, the figures shown in this report may diverge considerably from those which are quoted by media, published by national authorities or given in national budgets.
2 Equipment expenditure includes expenditure on major equipment as well as on research and development devoted to major equipment. Personnel expenditure includes pensions paid to retirees. The cut-off date for information used in this report was 2 June 2021. Figures for 2020. and 2021 are estimates. News and information is routinely placed on the nato website. This includes audio files, transcripts and high resolution photographs, which are posted as soon as possible after events of media interest. Check the 'What's New' file. Nouvelles et informations sont r guli rement affich es sur le site Web de l'OTAN, sous la forme de fichiers audio, de transcriptions et de photographies destin es la publication. Elles sont disponibles le plus rapidement possible apr s les v nements pr sentant un int r t pour les m dias. Cliquer sur "Quoi de neuf?". north atlantic treaty organisation organisation du Trait de l'Atlantique Nord Press & Media Presse & M dias B-1110 Bruxelles Belgique E-mail: Tel.
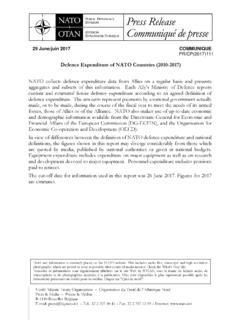
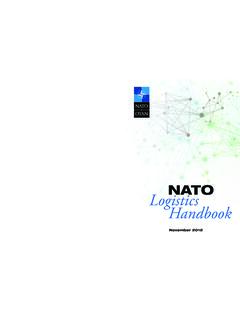
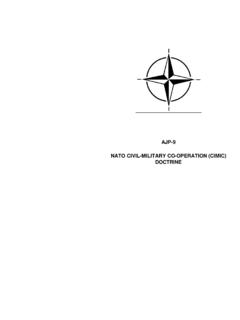
3 : 32 2 707 50 41 Fax: 32 2 707 13 99 Internet: Graph 1 : nato Europe and Canada - defence expenditure (annual real change, based on 2015 prices and exchange rates). %. 7. 6. 5. 4 3. 2 1. 0. -1. -2. -3. -4. 2012 2013 2014 2015 2016 2017 2018 2019 2020e 2021e Notes: Figures for 2020 and 2021 are estimates. The nato Europe and Canada aggregate from 2017 onwards includes Montenegro, which became an Ally on 5 June 2017, and from 2020 onwards includes north Macedonia, which became an Ally on 27 March 2020. Graph 2 : Defence expenditure as a share of GDP and equipment expenditure as a share of defence expenditure % 2021e 55. Equipment expenditure as % of defence expenditure Median nato guideline 2%. 50. 45. HRV. LUX. 40. GRC. 35. 30 TUR NOR. ITA HUN USA. FRA. NLD NMK SVK POL GBR. 25. DNK BGR ROU LVA. ESP Median ALB MNE LTU EST. 20 CZE. BEL DEU. CAN nato guideline 20%. 15 SVN PRT. 10. 5. 0. %. Defence expenditure as % of GDP. Note: Figures for 2021 are estimates. -2- Graph 3 : Defence expenditure as a share of GDP (%).
4 % (based on 2015 prices and exchange rates). nato guideline 2%. 2014 2021e Note: Figures for 2021 are estimates. Graph 4 : Equipment expenditure as a share of defence expenditure (%). (based on 2015 prices and exchange rates). %. 50. 45 40 35. 30 25 nato guideline 20%. 20 15. 10. 5. 0. 2014 2021e Note: Figures for 2021 are estimates. -3- Graph 5 : Defence expenditure (billion US dollars, based on 2015 prices and exchange rates). 1,200. 1,049. 1,001 1,027. 997. 1,000 949. 910 896 913 904 929. 256 310 323. 300. 800 253. 250 254 262 277 289. 600. 400. 741 696 702 717 726. 660 641 651 626 640. 200. 0. 2012 2013 2014 2015 2016 2017 2018 2019 2020e 2021e United States nato Europe and Canada Notes: Figures for 2020 and 2021 are estimates. The nato Europe and Canada aggregate from 2017 onwards includes Montenegro, which became an Ally on 5 June 2017, and from 2020 onwards includes north Macedonia, which became an Ally on 27 March 2020. Graph 6 : nato Europe and Canada - defence expenditure (billion US dollars, based on 2015 prices and exchange rates).
5 350. + BGR, EST, LVA, LTU, ROU, SVK, SVN + NMK. 325. + CZE, HUN, POL + ALB, HRV + MNE. 300. 275. 250 nato Europe and Canada 225. 200. 2001. 1989. 1990. 1992. 1993. 1994. 1995. 1996. 1997. 1998. 1999. 2000. 2002. 2003. 2004. 2005. 2006. 2007. 2008. 2009. 2010. 2012. 2013. 2014. 2015. 2016. 2017. 2018. 2019. 2020e 2021e 1991. 2011. Notes: Figures for 2020 and 2021 are estimates. Includes enlargements which took place in: 1999 (3 Allies), 2004 (7 Allies), 2009 (2 Allies), 2017 (1 Ally) and 2020 (1 Ally). -4- Graph 7 : Main categories of defence expenditure (%). (percentage of total defence expenditure). 2021e %. 100. 90 80 70 60 50 40. 30 20 10. 0. ALB BEL BGR CAN HRV CZE DNK EST FRA DEU GRC HUN ITA LVA LTU LUX MNE NLD NMK NOR POL PRT ROU SVK SVN ESP TUR GBR USA. Personnel Operations & maintenance and other expenditures Infrastructure Major equipment, including related R&D. Graph 8 : nato Europe and Canada - major equipment expenditure (annual real change, based on 2015 prices and exchange rates).
6 %. 16. 14. 12. 10. 8 6. 4 2. 0. -2. -4 -6. 2012 2013 2014 2015 2016 2017 2018 2019 2020e 2021e Notes: Figures for 2020 and 2021 are estimates. The nato Europe and Canada aggregate from 2017 onwards includes Montenegro, which became an Ally on 5 June 2017, and from 2020 onwards includes north Macedonia, which became an Ally on 27 March 2020. -5- Table 1 : Defence expenditure Million national currency units 2014 2015 2016 2017 2018 2019 2020e 2021e Current prices Albania (Leks) 18,788 16,671 16,250 17,199 18,995 21,987 20,353 24,481. Belgium (Euros) 3,913 3,789 3,848 3,932 4,101 4,253 4,755 5,337. Bulgaria (Leva) 1,102 1,116 1,186 1,255 1,593 3,772 1,843 2,012. Canada (Canadian dollars) 20,076 23,900 23,474 30,761 29,025 29,949 31,644 33,674. Croatia* (Kunas) 6,113 6,057 5,696 6,120 6,068 6,634 6,700 11,077. Czech Republic (Koruny) 41,003 47,264 45,598 52,805 59,752 66,737 74,300 85,274. Denmark (Kroner) 22,769 22,633 24,190 24,961 28,787 30,389 32,572 33,900. Estonia (Euros) 386 418 450 479 521 569 630 646.
7 France (Euros) 39,149 39,199 39,950 40,852 42,748 44,400 46,200 48,200. Germany (Euros) 34,749 35,898 37,598 40,265 42,127 46,936 51,610 53,170. Greece (Euros) 3,939 4,073 4,190 4,208 4,560 4,326 4,398 6,578. Hungary (Forint) 281,402 316,338 362,798 468,765 436,500 596,008 853,196 842,146. Italy (Euros) 18,427 17,642 20,226 21,166 21,702 21,042 22,844 24,427. Latvia** (Euros) 221 254 364 430 601 618 651 699. Lithuania** (Euros) 322 425 575 724 895 977 1,030 1,049. Luxembourg (Euros) 190 225 213 288 301 345 356 389. Montenegro (Euros) 52 51 56 58 64 66 72 79. Netherlands (Euros) 7,788 7,816 8,234 8,539 9,456 10,800 11,500 11,800. north Macedonia (Denars) 5,743 5,853 5,770 5,532 6,232 8,029 8,303 11,070. Norway (Kroner) 48,660 49,529 54,022 56,664 61,349 66,318 68,475 70,907. Poland** (Zlotys) 31,874 39,940 37,082 37,558 42,824 45,404 52,997 51,834. Portugal (Euros) 2,263 2,384 2,364 2,424 2,750 2,947 2,896 3,262. Romania** (New Lei) 9,014 10,337 10,738 14,765 17,183 19,527 21,437 23,121.
8 Slovak Republic (Euros) 752 889 907 935 1,098 1,610 1,796 1,677. Slovenia (Euros) 366 361 406 422 463 511 498 624. Spain (Euros) 9,508 10,000 9,014 10,528 11,172 11,281 11,240 12,208. Turkey (Liras) 29,727 32,522 38,203 47,323 68,300 79,987 93,910 99,024. United Kingdom (Pounds) 39,902 38,940 41,590 43,257 45,202 46,509 48,267 52,348. United States (US dollars) 653,942 641,253 656,059 642,933 672,255 730,149 784,952 811,140. Constant 2015 prices Albania (Leks) 18,894 16,671 16,354 17,061 18,590 21,416 20,017 23,734. Belgium (Euros) 3,965 3,789 3,775 3,789 3,888 3,966 4,388 4,870. Bulgaria (Leva) 1,128 1,116 1,156 1,177 1,437 3,233 1,529 1,589. Canada (Canadian dollars) 19,900 23,900 23,299 29,767 27,602 28,012 29,354 30,149. Croatia* (Kunas) 6,118 6,057 5,701 6,056 5,887 6,341 6,378 10,369. Czech Republic (Koruny) 41,410 47,264 45,084 51,539 56,861 61,144 65,354 72,755. Denmark (Kroner) 22,868 22,633 24,128 24,606 28,215 29,566 30,974 32,015. Estonia (Euros) 389 418 439 453 473 499 556 562.
9 France (Euros) 39,595 39,199 39,744 40,429 41,907 42,998 43,756 45,935. Germany (Euros) 35,394 35,898 37,105 39,205 40,344 43,985 47,620 48,427. Greece (Euros) 3,927 4,073 4,214 4,216 4,574 4,330 4,468 6,684. Hungary (Forint) 289,235 316,338 357,702 445,029 395,419 515,348 696,832 651,551. Italy (Euros) 18,734 17,642 19,769 20,511 21,081 20,276 21,752 23,066. Latvia** (Euros) 221 254 361 414 557 560 589 623. Lithuania** (Euros) 322 425 566 684 816 866 904 904. Luxembourg (Euros) 191 225 212 281 287 318 320 342. Montenegro (Euros) 53 51 54 53 57 57 63 68. Netherlands (Euros) 7,796 7,816 8,162 8,340 9,041 10,186 10,709 10,839. north Macedonia (Denars) 5,858 5,853 5,577 5,201 5,637 7,183 7,363 9,816. Norway (Kroner) 47,271 49,529 54,831 55,326 56,164 60,980 65,319 62,215. Poland** (Zlotys) 32,185 39,940 36,967 36,758 41,414 42,550 47,693 45,444. Portugal (Euros) 2,309 2,384 2,324 2,348 2,616 2,755 2,645 2,949. Romania** (New Lei) 9,308 10,337 10,482 13,768 15,089 16,059 16,992 17,753.
10 Slovak Republic (Euros) 750 889 912 928 1,069 1,528 1,666 1,532. Slovenia (Euros) 370 361 403 412 442 478 460 566. Spain (Euros) 9,560 10,000 8,985 10,360 10,864 10,820 10,667 11,490. Turkey (Liras) 32,059 32,522 35,330 39,434 48,859 50,234 51,362 45,848. United Kingdom (Pounds) 40,166 38,940 40,714 41,541 42,454 42,777 42,039 45,208. United States (US dollars) 660,062 641,253 651,201 626,328 640,277 701,563 716,886 725,709. Notes: Figures for 2020 and 2021 are estimates. * Year 2021: estimated average derived from the range reported. ** These Allies have national laws or political agreements which call for 2% of GDP to be spent on defence annually, consequently future estimates are expected to change accordingly. For past years Allies defence spending was based on the then available GDP data and Allies may, therefore, have met the 2% guideline when using those figures. (In 2018, Lithuania met 2% using November 2018 OECD figures.). -6- Table 2 : Defence expenditure Million US dollars 2014 2015 2016 2017 2018 2019 2020e 2021e Current prices and exchange rates Albania 178 132 131 145 176 200 188 239.