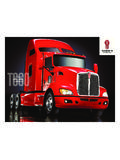
Transcription of 1Q18 Investor Presentation - paccar.com
1 April 2018 Page 2 This Presentation may contain statements that are forward looking. These statements are based on current expectations and assumptions that are subject to risks and uncertainties, which may cause actual results to differ materially. A summary of risks and uncertainties is described in more detail in our periodic reports filed with the Securities and Exchange Commission (SEC).We undertake no duty to update or revise this Presentation , whether as a result of new information, future events or otherwise. For the most recent financial, risk and other information about paccar , please see our SEC filings and most recent earnings release available on the Investor Relations page of 2018 Page 3 April 2018 Page 4 Aftermarket SupportFinancial ServicesInformation TechnologyPowertrainCommercial VehiclesApril 2018 Page 5 paccar StrategyPremium Products and ServicesProfitable Market Share GrowthGeographic ExpansionQualityQualityTechnologyTechnol ogyInnovationInnovationApril 2018 Page 6 QualityHighest IntegrityOperational ExcellenceConservative Financial ManagementLong-Term PerspectivePACCAR ValuesApril 2018 Page 771%13%10%6%0%10%20%30%40%50%60%70%80%Tr uckRailPipelineWater% Total Freight Tonnage Hauled by Transportation ModeTrucking
2 Moves the EconomyIf you bought it, it probably was delivered by a truck20122017 Units in Thousands2012 Million2017 MillionPACCAR Truck AssemblyNorth AmericaSouth AmericaAfrica & Middle EastEU28 IndiaRest of AsiaRussia/CISC hina ,345925232370230202420282215315280190195 110220 Global >6t Truck MarketApril 2018 Page 9050100150200250300350050100150200250300 35002 03 04 05 06 07 08 09 10 11 12 13 14 15 16 17 18 Units (000s)Units (000s) US & Canada Europe South America>16t Truck Market SizeApril 2018 Page 100%5%10%15%20%25%30%35%40%0%5%10%15%20% 25%30%35%40%S. and CanadaMexico199720072017 paccar Heavy Duty Market ShareApril 2018 Page 11050100150200250300 HualingDayunNavistarIsuzuKamAZIvecoHinoH ongyanJianghuaiAshok LeylandTata MotorsBeijing FotonPACCARV olkswagenShaanxiVolvoSinotrukDongfengDai mlerFAWT otal Production 2017 = Million#8>16t Truck Manufacturing2017 Production (Units 000s)April 2018 Page 120204060801001201401602008 2009 2010 2011 20122013 2014 2015 2016 2017 Units (000s)
3 BrasilAustraliaMexicoCanadaUSEuropePACCA R Truck Million Trucks Produced 2008 - 2018 Page 130510152025051015202597 99 01 03 05 07 09 11 13 15 17$ Billions$ 99 01 03 05 07 09 11 13 15 17$ Billions$ BillionsNet IncomeNet IncomeAdj Net Inc *Tax Benefit ** 99 01 03 05 07 09 11 13 15 17$ Billions$ BillionsOperating Cash Flow015030045060075090001503004506007509 0097 99 01 03 05 07 09 11 13 15 17$ Millions$ MillionsCapital Investments and R&D ExpensesCapitalR&DPACCARE xcellent Financial Performance Throughout the Business CycleCAGR = 5%CAGR = 8%CAGR = 10%* 2016 adjusted net income excludes non-recurring European Commission charge of $833 million.
4 ** 2017 One-time tax benefit of $173 million from the new tax law. S paccar 2017 10K flt i ftiNGAAPA pril 2018 Page 14-9%-6%-3%0%3%6%9%12%-9%-6%-3%0%3%6%9%1 2%08091011121314151617 paccar Volvo DaimlerVolkswagen IvecoNavistarBest-in-Class Operating EfficiencyCommercial Vehicle Segment Operating MarginApril 2018 Page 1504812162024048121620240809101112131415 1617 paccar Volvo DaimlerVolkswagenCNHN avistarBest-in-Class Operating EfficiencyInventory TurnsApril 2018 Page 160%4%8%12%16%0%4%8%12%16%08091011121314 151617 paccar Volvo DaimlerVolkswagenCNHN avistarBest-in-Class Operating EfficiencySG&A % of SalesApril 2018 Page 1701,2502,5003,7505,0006,2507,5008,75010 ,00011.
5 25002040608010012014016018090 91 92 93 94 95 96 97 98 99 00 01 02 03 04 05 06 07 08 09 10 11 12 13 14 15 16 17$/TruckUnits (000s)TrucksNet Income per TruckNet Income per TruckApril 2018 Page 18 paccar IncA+/A1 Credit Ratings($ Millions)3/31/18 Cash & Securities$ 3,472 Manufacturing Assets6,720 Financial Services Assets13,590 Total Assets$ 23,782 Manufacturing Debt $ 0 Manufacturing Liabilities4,841 Financial Services Liabilities10,373 Shareholders' Equity8,568 Total Liabilities & Equity$ 23,782 April 2018 Page 19 paccar Overview Q1 2018 Consolidated Sales & Revenues $ BillionNet Income $512 Million paccar Financial Pre Tax Profit $68 MillionPACCAR Parts Record Pre Tax Profit $192 MillionStockholders Equity $ BillionA1/A+ Credit RatingsRegular Dividend Increased 25% in Last 5 YearsConsolidated Sales & Revenues $ BillionNet Income $512 Million paccar Financial Pre Tax Profit $68 MillionPACCAR Parts Record Pre Tax Profit $192 MillionStockholders Equity $ BillionA1/A+ Credit RatingsRegular Dividend Increased 25% in Last 5 YearsApril 2018 Page 20 paccar Revenues and Profit79 consecutive years of net profitDividends every year since 1941
6 First Quarter($ in Millions)20172018 Revenues$4,238$5,654 Net Income$310$512 Return on EPS$ $ of Trucks Delivered35,00044,500 April 2018 Page 21 Capex$ R&D$ Dividend$ Share Repurchase$ Finance Company$ Debt Repayment$ Increase in Cash$ paccar Capital AllocationUses of Cash Flow2013 2017: $ BillionCapital Allocation Strategy Quarterly plus special dividends Strategic share repurchases R&D and capex investments drive future growth Credit rating of A+/A1 reflects strategic nature of our financial services operations Long history of successful acquisitions; highly selective, strategic, clear path to value creationNew ProductsNew DAF XF and CFPACCAR PowertrainKenworth Australia T610 Peterbilt Model 579 UltraLoftInnovative TechnologiesZero-Emissions Kenworth T680 DAF Connect/Truck Tech/Smart LinQPlatooningAutonomous Driving TechnologiesPACCAR InvestmentsDAF Sales Office, Haddenham, , McKinney, TexasPACCAR Engine FactoriesDAF Cab Paint Facility, Westerlo, BelgiumApril 2018 Page 2502004006008001,0001,20002004006008001, 0001.
7 20098 99 00 01 02 03 04 05 06 07 08 09 10 11 12 13 14 15 16 17$ Millions$ Millions Dividends Stock RepurchasedDividends Declared and Stock RepurchasesApril 2018 Page 26 paccar Engines WorldwidePACCAR LiterPACCAR LiterPACCAR LiterPACCAR PX-5 LiterPACCAR LiterPACCAR LiterApril 2018 Page 2701002003004005006007000100200300400500 6007000708091011121314151617# of Engines (000s)# of Engines (000s)DAF MX 13KW/PB MX 13MX 11 Cumulative paccar MX Engines ProducedApril 2018 Page 2805001,0001,5002,0002,5003,0003,5000500 1,0001,5002,0002,5003,0003,50003 04 05 06 07 08 09 10 11 12 13 14 15 16 17$ Millions$ MillionsCAGR = 8% paccar Parts RevenuesApril 2018 Page 29 Parts Distribution Centers and DealersPACCAR Distribution CentersKW, PB, DAF Dealers29 paccar Parts InvestmentsToronto, CanadaPanama City, PanamaRenton, WashingtonBrisbane.
8 AustraliaPACCAR Global Dealer NetworkDAF BrasilApril 2018 Page 33 Road to Autonomous Commercial Vehicles Anti Lock Braking Lane Departure Warning Object Detection Adaptive Cruise ControlComponent Controls1980-2014 Autonomous Emergency Braking Predictive Cruise ControlSystem Integration2015-2017 Vehicle to Infrastructure Network Automatic Lane Change Automatic RoutingAutomated Vehicle2025+Greater Vehicle Autonomy Improves Fleets Safety, Fuel Efficiency and Truck Utilization Increases Truck Content Increases Parts Demand Lane Keeping Assist Traffic Jam Assist Platooning Driver MonitoringNetwork Integration2018-2024 Environmental LeadershipMember CDP (Carbon Disclosure Project)Reduce Environmental Impact Through Product DesignProduct Recyclability90%+ Reduction in NOx and Particulate EmissionsAlternative Fuel Vehicles (Natural Gas, Hybrid)Zero Waste to Landfill Environmental Certification (ISO 14001)
9 EPA SmartWayApril 2018 Page 35 paccar Financial Services Q1 2018$ Billion in AssetsPre tax Profit $68 Million Full Service LeasingDealer Floorplan Retail Financing187,000 Vehicles FinancedApril 2018 Page 36 paccar Financial Services24 Countries on Four ContinentsPACCAR Financial Regional OfficesBellevueSalt LakeMexicaliChicagoDentonMelbourneAtlant aPhiladelphiaTorontoSpartanburgMexico CityMadridMilanWarsawPragueEindhovenLond onParisLos AngelesApril 2018 Page 3701234567801234567891 93 95 97 99 01 03 05 07 09 11 13 15 17%%Low 30+ Days Past DuePACCAR Financial ServicesTotal Assets 12/31/17 = $ & Canada$ Billion 48% Europe$ Billion 24%Australia & Mexico$ Billion 10%PacLease$ Billion 18% April 2018 Page 09 10 11 12 13 14 15 16 17 Assets BillionsAssets BillionsPACCAR Financial Europe50.
10 300 Vehicles200 DAF Dealers17 European CountriesApril 2018 Page 390510152025303540051015202530354008 09 10 11 12 13 14 15 16 17 Trucks (000s)Trucks (000s) paccar Leasing37,900 Vehicles574 Locations$ Billion in AssetsApril 2018 Page 40 paccar Financial Services3/31/18 Finance & Other Receivables$10,104 Equipment on Operating Leases2,874 Other Assets612 Total Financial Services Assets$13,590 Commercial Paper & Bank Loans$3,234 Term Notes5,896 Deferred Taxes & Other Liabilities1,243 Total Financial Services Liabilities10,373 Equity3,217 Total Liabilities & Equity$13,590($ Millions)April 2018 Page 41 paccar Competitive AdvantagesExcellent Shareholder ReturnExperienced Management TeamHighest Quality ProductsRigorous Cost ControlBalanced Global DiversificationExcellent Supplier PartnershipsExtensive Capital InvestmentsInnovative TechnologyGlobal Aftermarket Parts SalesStrongest Dealer NetworkProfitable Financial ServicesApril 2018 Page 42
