Transcription of 2.22010200 2.2 2.2 . 201 EDUCATION 45% 1 INDICATORS …
1 EDUCATION data EDUCATION evidence EDUCATION policy EDUCATION analysis EDUCATION statistics1IN2012/01 (January) INDICATORS In focus 2012/01 (January) OECD 2012 EDUCATION INDICATORS focus Between 2008 and 2009, unemployment rates across OECD countries increased among people at all educational levels, but rose to especially troubling heights among people without an upper secondary EDUCATION . I n 2009, the average employment rate across OECD countries was much higher for individuals with a tertiary ( higher) EDUCATION indicating a better match between the skills these people have and the skills the labour market required. Between 2008 and 2009, the earnings advantage for people with a tertiary EDUCATION remained strong in OECD countries. In some countries, earnings inequality between people with a tertiary EDUCATION and those without an upper secondary EDUCATION widened even has the global economic crisis affected people with different levels of EDUCATION ?
2 As the debt crisis in the Western world, stubbornly high unemployment rates, and stagnating economic growth in many countries create an uncertain outlook for 2012, it s a good time to take stock of how the global economic crisis that began in 2008 has affected people throughout the world. Within the OECD s member and partner countries, the lesson is clear: The economic downturn hit individuals with lower levels of EDUCATION much harder. As the crisis ramped up in 2008 and continued in 2009, overall unemployment rates among 25-64 year-olds increased across the board in OECD countries. However, the impact was much more pronounced for individuals without an upper secondary EDUCATION . Among this group, unemployment rates rose an average of percentage points between 2008 and 2009, from an already high to Men and women in this group were particularly hard hit in Estonia, Ireland, Spain and the United States, where unemployment rates among people without an upper secondary EDUCATION jumped 5 percentage points or more between these two impact of the crisis was somewhat milder among 25-64 year-olds with an upper secondary or post-secondary, non-tertiary attainment as their top EDUCATION level.
3 Among this group, unemployment rates in OECD countries rose an average of nearly 2 percentage points between 2008 and 2009, from to In several countries Estonia, Ireland, the Slovak Republic, Spain, and Turkey unemployment rates reached 10% or more among people with this level of EDUCATION , and nearly did so in the United States as contrast, people with a tertiary ( higher) EDUCATION fared much better than their less-educated counterparts during the thick of the global recession. Overall, unemployment rates among 25-64 year-olds with this level of EDUCATION in OECD countries rose just percentage points between 2008 and 2009, from to less than half the spike in unemployment among individuals without an upper secondary EDUCATION . Individuals EDUCATION levels had a big impact on how the crisis affected the height of the crisis, people with lower levels of EDUCATION were much more likely to be data EDUCATION evidence EDUCATION policy EDUCATION analysis EDUCATION statistics OECD 2012 EDUCATION INDICATORS In focus 2012/01 (January) 2 EDUCATION INDICATORS IN figures underscore the large competitive advantage that people with higher levels of EDUCATION have in the labour market both in general and in difficult economic times.
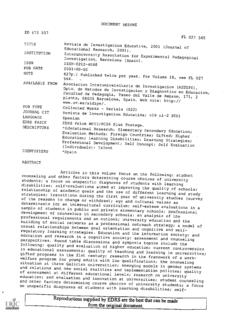
4 On average across all OECD countries, of 25-64 year-olds with a tertiary EDUCATION were employed in 2009, compared to of 25-64 year-olds without an upper secondary EDUCATION a difference of percentage points. In the Czech Republic, Hungary, Poland and the Slovak Republic, this gap was more than 40 percentage points, while in Iceland, Korea, and New Zealand, it was 15 percentage points or less. Below upper secondary educationUpper secondaryand post-secondarynon-tertiaryTertiaryeducat ion010203040 Percentage010203040 Percentage010203040 PercentageChange in unemployment rates, by level of EDUCATION (2008-09)Countries are ranked in descending order of the unemployment rate in 2009 for individuals with upper secondary and post-secondary non-tertiary : EDUCATION at a Glance 2011: OECD INDICATORS , indicator A7 ( ).
5 20092008 SpainEstoniaTurkeyIrelandSlovak RepublicUnited StatesGreeceHungaryPortugalCanadaFinland IsraelGermanyChilePolandBrazilFranceOECD averageBelgiumSwedenJapanUnited KingdomItalySloveniaCzech RepublicDenmarkMexicoAustraliaNew ZealandKoreaAustriaLuxembourgSwitzerland NetherlandsNorwaySpainEstoniaTurkeyIrela ndSlovak RepublicUnited StatesGreeceHungaryPortugalCanadaFinland IsraelGermanyChilePolandBrazilFranceOECD averageBelgiumSwedenJapanUnited KingdomItalySloveniaCzech RepublicDenmarkMexicoAustraliaNew ZealandKoreaAustriaLuxembourgSwitzerland NetherlandsNorwayNotably, 2009 unemployment rates remained at 5% or less for tertiary-educated individuals in 24 out of 34 OECD countries, as well as the partner country Brazil. Moreover, 2009 unemployment rates for this group surpassed 8% in only two OECD countries Spain and Turkey.
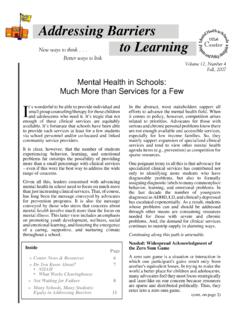
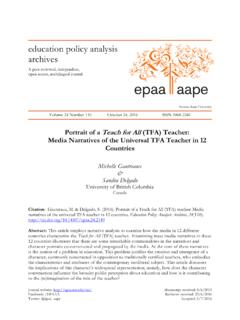
6 While people with higher levels of EDUCATION were much more likely to be in steady data EDUCATION evidence EDUCATION policy EDUCATION analysis EDUCATION INDICATORS IN FOCUSE ducation INDICATORS In focus 2012/01 (January) OECD 2012 The employment rate vs. the unemployment rate Despite common misconceptions, the employment rate and the unemployment rate are not directly related to each other. The employment rate refers to the number of people in employment as a percentage of the population of working age. The unemployment rate measures the number of individuals who are without work, actively seeking employment, and available to start work as a percentage of the civil labour force, during a specific reference to read this chartThe chart shows the positive relation between EDUCATION and employment.
7 People who have completed upper secondary EDUCATION are more likely to be in work than people with below a upper secondary EDUCATION , and people with a tertiary EDUCATION are more likely to be in work than those with an upper secondary EDUCATION . The magnitude of the employment advantage varies across Upper secondary and post-secondary non-tertiary EDUCATION Below upper secondary EDUCATION Percentage of 25-64 year-olds in employment, by level of EDUCATION (2009)NorwaySwitzerlandSloveniaIcelandSw edenNetherlandsDenmarkPortugalAustriaGer manyBrazilPolandLuxembourgUnited KingdomFinlandCzech RepublicAustraliaBelgiumNew ZealandOECD averageFranceSlovak RepublicEstoniaIsraelGreeceIrelandCanada MexicoSpainUnited StatesJapanItalyHungaryChileKoreaTurkeyC ountries are ranked in descending order of the employment rate for individuals with tertiary : EDUCATION at a Glance 2011: OECD INDICATORS , indicator A7 ( ).
8 Tertiary EDUCATION Similarly, tertiary-educated individuals were employed at higher rates than people with an upper secondary or post-secondary, non-tertiary EDUCATION . On average across all OECD countries, of 25-64 year-olds at these educational levels were employed in 2009 a difference of percentage points from the employment rate among tertiary-educated individuals. While a number of factors, most notably, women s participation in the labour force, contribute to variations in employment rates among countries, higher employment rates for people with more EDUCATION point to a better match between the skills these individuals possess and the skills the labour market demands, even during periods of economic crisis. The earnings advantage for the typical employee with a tertiary EDUCATION held strong during the premiums and penalties, by level of EDUCATION (2008-2009)Total Population, 25-64 year-olds(compared to average earnings for people with an upper secondary or post-secondary, non-tertiary EDUCATION )Country Average*20082009 Tertiary+56%+57%Below upper secondary-23%-23%*Average includes 14 OECD countries with available data for both OECD 2012 EDUCATION INDICATORS In focus 2012/01 (January) INDICATORS IN focus EDUCATION data EDUCATION evidence EDUCATION policy EDUCATION analysis EDUCATION statisticsComing next month:What public support do students around the world receive for higher EDUCATION ?
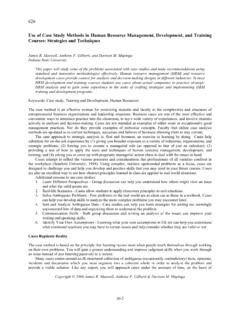
9 For more information, LaRock at a Glance 2011: OECD s more, the earnings premium that tertiary-educated people typically enjoy in the labour market held strong during the crisis years of 2008 and 2009. In 2008, among 14 OECD countries with comparable data for the following year, the typical tertiary-educated employee earned 56% more than the typical employee with an upper secondary or post-secondary, non-tertiary EDUCATION , on average. Yet despite the economic crisis, this premium increased slightly to 57% in 2009. By contrast, the typical employee without an upper secondary EDUCATION earned 23% less than a corresponding worker with that level of EDUCATION in 2008, on average across these countries. This earnings disadvantage remained the same in 2009.
10 200150100500-50-100% premium or penaltyBelow upper secondary educationTertiary educationEarnings premiums and penalties, by level of EDUCATION By country, 25-64 year-olds (2009 or latest available year)Compared to average earnings for people with upper secondary or post-secondary, non-tertiary educationBrazilHungarySloveniaCzech RepublicSlovak RepublicUnited StatesPortugalPoland1 LuxembourgIrelandUnited KingdomNetherlands1 GermanyAustriaSwitzerland1 IsraelOECD averageGreeceItaly1 Turkey2 Japan3 FranceFinland1 Spain1 Canada1 EstoniaAustraliaBelgiumKorea1 Norway1 DenmarkSwedenNew ZealandNote: Belgium, Korea and Turkey report earnings net of income tax. e Czech Republic, Hungary, Luxembourg, Poland, Portugal and Slovenia report earnings excluding data for individuals in part-time work.