Transcription of 2–3 Histograms, Frequency Polygons, and Ogives - Weebly
1 Analysis, selectHistogramand click the [OK] the Histogramdialog box, type A1:A50as the Input Worksheet Ply, and check the Cumulative Percentage option. Click[OK].By leaving the chart output unchecked, the new worksheet will display the table only. Itdecides bins for the histogram itself (here it picked a bin size of 7 units), but you can alsodefine your own bin range on the data 2 Frequency Distributions and Graphs2 162 3 Histograms, Frequency Polygons, and OgivesAfter the data have been organized into a Frequency distribution, they can be presentedin graphical form. The purpose of graphs in statistics is to convey the data to the viewersin pictorial form. It is easier for most people to comprehend the meaning of data pre-sented graphically than data presented numerically in tables or Frequency is especially true if the users have little or no statistical graphs can be used to describe the data set or to analyze it.
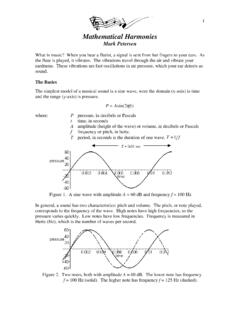
2 Graphs are alsouseful in getting the audience s attention in a publication or a speaking presentation. Theycan be used to discuss an issue, reinforce a critical point, or summarize a data set. Theycan also be used to discover a trend or pattern in a situation over a period of three most commonly used graphs in research are as Frequency cumulative Frequency graph, or ogive (pronounced o-jive).An example of each type of graph is shown in Figure 2 1. The data for each graph arethe distribution of the miles that 20 randomly selected runners ran during a given HistogramThehistogramis a graph that displays the data by using contiguous vertical bars(unless the Frequency of a class is 0) of various heights to represent the frequencies ofthe Represent datain frequencydistributionsgraphically usinghistograms, frequencypolygons, and 2 4 Construct a histogram to represent the data shown for the record high temperatures foreach of the 50 states (see Example 2 2).
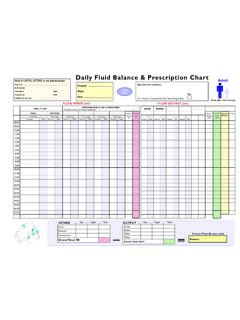
3 Class 1 Draw and label the xandyaxes. The xaxis is always the horizontal axis, andtheyaxis is always the vertical 2 3 Histograms, Frequency Polygons, and Ogives492 17 Class boundaries(a) Histogram(b) Frequency midpoints(c) Cumulative Frequency graph1381823283338 Frequency12345 Class frequency2481216610141820xyxyxyHistogram for Runners TimesFrequency Polygon for Runners TimesOgive for Runners TimesFigure 2 1 Examples ofCommonly UsedGraphsStep 2 Represent the Frequency on the yaxis and the class boundaries on the 3 Using the frequencies as the heights, draw vertical bars for each class. SeeFigure 2 the histogram shows, the class with the greatest number of data values (18) , followed by 13 for The graph also has one peak with thedata clustering around Frequency PolygonAnother way to represent the same data set is by using a Frequency polygon is a graph that displays the data by using lines that connectpoints plotted for the frequencies at the midpoints of the classes.
4 The frequencies arerepresented by the heights of the 2 5 shows the procedure for constructing a Frequency 2 Frequency Distributions and Graphs2 18 Temperature ( F)Record High Frequency6309121518xyFigure 2 2 Histogram forExample 2 4 Historical NoteGraphs originatedwhen ancientastronomers drew theposition of the stars inthe heavens. Romansurveyors also usedcoordinates to locatelandmarks on developmentof statistical graphscan be traced toWilliam Playfair(1748 1819), anengineer and drafterwho used graphs topresent economicdata 2 5 Using the Frequency distribution given in Example 2 4, construct a Frequency 1 Find the midpoints of each class. Recall that midpoints are found by addingthe upper and lower boundaries and dividing by 2:and so on. The midpoints areClass 102 107 Step 2 Draw the xandyaxes.
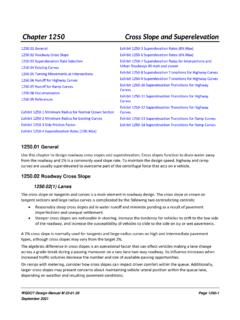
5 Label the xaxis with the midpoint of each class, andthen use a suitable scale on the yaxis for the 3 Using the midpoints for the xvalues and the frequencies as the yvalues, plotthe 4 Connect adjacent points with line segments. Draw a line back to the xaxis atthe beginning and end of the graph, at the same distance that the previous andnext midpoints would be located, as shown in Figure 2 Frequency polygon and the histogram are two different ways to represent thesame data set. The choice of which one to use is left to the discretion of the OgiveThe third type of graph that can be used represents the cumulative frequencies forthe classes. This type of graph is called the cumulative Frequency Frequency is the sum of the frequencies accumulated up to the upper bound-ary of a class in the a graph that represents the cumulative frequencies for the classes in afrequency 2 6 shows the procedure for constructing an 2 3 Histograms, Frequency Polygons, and Ogives512 19 Figure 2 3 Frequency Polygon forExample 2 5xTemperature ( F)Record High Temperaturesy102 107 112 117 122 127 132 Frequency6309121518 Example 2 6 Construct an ogive for the Frequency distribution described in Example 2 1 Find the cumulative Frequency for each boundariesCumulative 2 Draw thexandyaxes.
6 Label the xaxis with the class boundaries. Use anappropriate scale for the yaxis to represent the cumulative frequencies.(Depending on the numbers in the cumulative Frequency columns, scales suchas 0, 1, 2, 3, .. , or 5, 10, 15, 20, .. , or 1000 , 2000 , 3000, .. can be the yaxis with the numbers in the cumulative frequencycolumn.) In this example, a scale of 0, 5, 10, 15, .. will be 3 Plot the cumulative Frequency at each upper class boundary, as shown inFigure 2 4. Upper boundaries are used since the cumulative frequenciesrepresent the number of data values accumulated up to the upper boundaryof each 4 Starting with the first upper class boundary, , connect adjacent pointswith line segments, as shown in Figure 2 5. Then extend the graph to the firstlower class boundary, , on the Frequency graphs are used to visually represent how many values arebelow a certain upper class boundary.
7 For example, to find out how many record hightemperatures are less than F, locate F on thexaxis, draw a vertical line upuntil it intersects the graph, and then draw a horizontal line at that point to theyaxis. Theyaxis value is 28, as shown in Figure 2 2 Frequency Distributions and Graphs2 20 Temperature ( F) Cumulativefrequency10502030405015253545x yFigure 2 4 Plotting the CumulativeFrequency forExample 2 6 Temperature ( F) Cumulativefrequency10502030405015253545 Record High TemperaturesyxFigure 2 5 Ogive for Example 2 6 Relative Frequency GraphsThe histogram, the Frequency polygon, and the ogive shown previously were constructedby using frequencies in terms of the raw data. These distributions can be converted to dis-tributions using proportions instead of raw data as frequencies.
8 These types of graphs arecalledrelative Frequency of relative frequencies instead of frequencies are used when the proportionof data values that fall into a given class is more important than the actual number of datavalues that fall into that class. For example, if one wanted to compare the age distribu-tion of adults in Philadelphia, Pennsylvania, with the age distribution of adults of Erie,Pennsylvania, one would use relative Frequency distributions. The reason is that since thepopulation of Philadelphia is 1,478,002 and the population of Erie is 105,270, the barsusing the actual data values for Philadelphia would be much taller than those for the sameclasses for convert a Frequency into a proportion or relative Frequency , divide the frequencyfor each class by the total of the frequencies.
9 The sum of the relative frequencies willalways be 1. These graphs are similar to the ones that use raw data as frequencies, but thevalues on the yaxis are in terms of proportions. Example 2 7 shows the three types ofrelative Frequency 2 3 Histograms, Frequency Polygons, and Ogives532 21 Figure 2 6 Finding a SpecificCumulative FrequencyTemperature ( F) Cumulativefrequency105020304050152535284 5xyRecord High TemperaturesProcedure TableConstructing Statistical GraphsStep 1 Draw and label 2 Choose a suitable scale for the frequencies or cumulative frequencies, and label iton the 3 Represent the class boundaries for the histogram or ogive, or the midpoint for thefrequency polygon, on the 4 Plot the points and then draw the bars or StatTwenty-two percentof Americans sleep6 hours a day or steps for drawing these three types of graphs are shown in the followingProcedure 2 Frequency Distributions and Graphs2 22 Example 2 7 Construct a histogram, Frequency polygon, and ogive using relative frequencies for thedistribution (shown here)
10 Of the miles that 20 randomly selected runners ran during agiven Cumulative 1 Convert each Frequency to a proportion or relative Frequency by dividing thefrequency for each class by the total number of class , the relative Frequency is ; for class ,the relative Frequency is ; for class , the relative frequencyis ; and so these values in the column labeled Relative 2 Find the cumulative relative frequencies. To do this, add the Frequency in eachclass to the total Frequency of the preceding class. In this case, 0 , , , , etc. Placethese values in the column labeled Cumulative relative the same procedure, find the relative frequencies for the Cumulativefrequency column.