Transcription of 2 Signal Processing Fundamentals - Purdue University
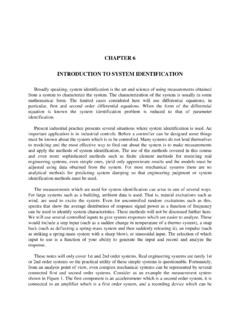
1 2 Signal Processing Fundamentals We can t hope to cover all the important details of one- and two- dimensional Signal Processing in one chapter. For those who have already seen this material, we hope this chapter will serve as a refresher. For those readers who haven t had prior exposure to Signal and image Processing , we hope that this chapter will provide enough of an introduction so that the rest of the book will make sense. All readers are referred to a number of excellent textbooks that cover one- and two-dimensional Signal Processing in more detail. For information on 1-D Processing the reader is referred to [McG74], [Sch75], [Opp75], [Rab75]. The theory and practice of image Processing have been described in [Ros82], [Gon77], [Pra78]. The more general case of multidimensional Signal Processing has been described in [Dud84]. One-Dimensional Signal Processing Continuous and Discrete One-Dimensional Functions One-dimensional continuous functions, such as in Fig.
2 (a), will be represented in this book by the notation x(t) (1) where x(t) denotes the value as a function at t. This function may be given a discrete representation by sampling its value over a set of points as illustrated in Fig. (b). Thus the discrete representation can be expressed as the list - * - X(-T), x(O), X(T), x(27), * * *, x(m), * - - . (2) As an example of this, the discrete representation of the data in Fig. (c) is 1, 3, 4, 5, 4, 3, 1. (3) It is also possible to represent the samples as a single vector in a multidimensional space. For example, the set of seven samples could also be represented as a vector in a 7-dimensional space, with the first element of the vector equal to 1, the second equal to 3, and so on. There is a special function that is often useful for explaining operations on functions. It is called the Dirac delta or impulse function.
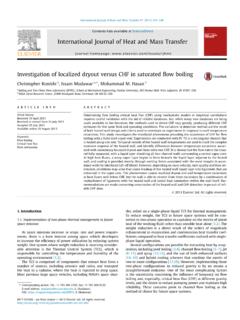
3 It can t be defined Signal Processing Fundamentals 5 c J 1 3 4 5 4 3 1 : 1 3 4 5 4 3 1 directly; instead it must be expressed as the limit of a sequence of functions. First we define a new function called rect (short for rectangle) as follows Fig. : A one-dimensional Signal is shown in (a) with its sampled version in (b). The discrete version of the Signal is illustrated in (c). rect (t) = 1 (4) 0 elsewhere. This is illustrated in Fig. (a). Consider a sequence of functions of ever decreasing support on the t-axis as described by &(t)=n rect (nt) (5) and illustrated in Fig. (b). Each function in this sequence has the same area but is of ever increasing height, which tends to infinity as n + 03. The limit of this sequence of functions is of infinite height but zero width in such a manner that the area is still unity. This limit is often pictorially represented as shown in Fig.
4 (c) and denoted by S(t). Our explanation leads to the definition of the Dirac delta function that follows s - 6(-t) dt=l. (6) -co The delta function has the following sampling property s - x(t)&t- t ) dt=x(t ) (7) -cc 6 COMPUTERIZED TOMOGRAPHIC IMAGING (4 Fig. : A rectangle function as where 6(t - t ) is an impulse shifted to the location t = t . When an impulse shown in (a) is scaled in both width and height (b). In the limit enters into a product with an arbitrary x(t), all the values of x(t) outside the the result is the delta function location t = t are disregarded. Then by the integral property of the delta illustrated in (c). function we obtain (7); so we can say that 13(t - t ) samples the function x(t) at t . Linear Operations Functions may be operated on for purposes such as filtering, smoothing, etc. The application of an operator 0 to a function x(t) will be denoted by orx(t)l.
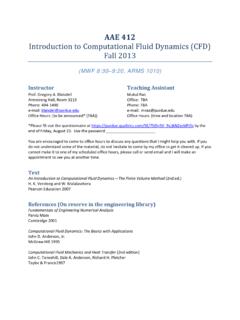
5 (8) The operator is linear provided otQX(f)+~~(t)l=~otx(t)l+pOtu(t)l (9) for any pair of constants a! and p and for any pair of functions x(t) and y(t). An interesting class of linear operations is defined by the following integral form z(t)= j , x(t )h(t, t ) dt (10) where h is called the impulse response. It is easily shown that h is the system response of the operator applied to a delta function. Assume that the input Signal Processing Fundamentals 7 Fig. : The impulse response of a shift invariant filter is shown convolved with three impulses. function is an impulse at t = to or x(t)=tqt-to). (11) Substituting into (lo), we obtain z(t) = jy , 6(t - to)h(t, t ) dt (12) = h(t, to). (13) Therefore h(t, t ) can be called the impulse response for the impulse applied at t . A linear operation is called shift invariant when u(t) = 0 tx(ol (14) implies y(t--7)=O[x(t-7)] (1% or equivalently h(t, t )=h(t-t ).)
6 (16) This implies that when the impulse is shifted by t , so is the response, as is further illustrated in Fig. In other words, the response produced by the linear operation does not vary with the location of the impulse; it is merely shifted by the same amount. For shift invariant operations, the integral form in (10) becomes This The z(t)= Co s x(t )h(t- t ) dt . (17) -m is now called a convolution and is represented by z(t) =x(t)*h(t). W-4) process of convolution can be viewed as flipping one of the two functions, shifting one with respect to the other, multiplying the two and integrating the product for every shift as illustrated by Fig. 8 COMPUTERIZED TOMOGRAPHIC IMAGING (1) L- 0 2 4 6 6 ,- j- )7- -2 h(t) L 0 2 4 6 6 -i IL- 0 2 4 6 6 A A x(t) h(t) IS- IS- A IS- y(t) - = 05- 7 b w -2 0 2 4 6 6 -2 0 2 4 6 6 -2 0 2 4 6 6 Fig. : The results of convolving an impulse response with an impulse (top) and a square pulse (bottom) are shown Convolution can also be defined for discrete sequences.
7 If xj=x(i7) and Yi=Y(id then the convolution of x; with yi can be written as (19) (20) (21) This is a discrete approximation to the integral of (17). Fourier Representation For many purposes it is useful to represent functions in the frequency domain. Certainly the most common reason is because it gives a new perspective to an otherwise difficult problem. This is certainly true with the Signal Processing Fundamentals 9 convolution integral; in the time domain convolution is an integral while in the frequency domain it is expressed as a simple multiplication. In the sections to follow we will describe four different varieties of the Fourier transform. The continuous Fourier transform is mostly used in theoretical analysis. Given that with real world signals it is necessary to periodically sample the data, we are led to three other Fourier transforms that approximate either the time or frequency data as samples of the continuous functions.)
8 The four types of Fourier transforms are summarized in Table Assume that we have a continuous function x(t) defined for Tl I t 15 Tz. This function can be expressed in the following form: x(t)= 2 zkejkuot k=-m (22) where j = a and w. = 2rfo = 27r/T, T = T2 - T, and zk are complex coefficients to be discussed shortly. What is being said here is that x(t) is the sum of a number of functions of the form #qt. (23) This function represents dkoot = cos kwo t +j sin kwo t. (24) The two functions on the right-hand side, commonly referred to as sinusoids, are oscillatory with kfo cycles per unit of t as illustrated by Fig. kfo is Table : Four different Fourier transforms can be defined by sampling the time and frequency domains. * Continuous Time Discrete Time Name: Fourier Transform Name: Discrete Fourier Transform Continuous Forward: X(w) = I:, x(t)e-jwf dt Forward: X(w) = C;= _ m x(nr)e-ion7 Frequency Inverse: x(f) = 1/2?
9 R {:, X(w)ejot du Inverse: x(nr) = 7/27r S_* ,:, X(4ejwnr dw Periodicity: None Periodic@: X(w) = X(w + i(27r/r)) Name: Fourier Series Name: Finite Fourier Transform Discrete Forward: X,, = l/T j~x(f)e-jn(2r *)f Forward: Xk = l/N ~~zO x,e -j(2* N)kn Frequency Inverse: x(t) = C;= _ m Xnejn(z~/r)r Inverse: xk= zf==, x&i(2* N)kn Periodicity: x(t) = x(t + iT) Periodic@: xk = xk+ iN and Xk = Xk+ iN * In the above table time domain functions are indicated by x and frequency domain functions are X. The time domain sampling interval is indicated by 7. 10 COMPUTERIZED TOMOGRAPHIC IMAGING cos(2nkll sin(2rkl) Fig. : The first three components of a Fourier series are shown. The cosine waves represent the real part of the Signal while the sine waves represent the imaginary. called the frequency of the sinusoids. Note that the sinusoids in (24) are at multiples of the frequency fo, which is called the fundamental frequency.))}
10 The coefficients zk in (22) are called the complex amplitude of the kth component, and can be obtained by using the following formula 1 I T2 Zk=- T TI x(t)e-ikmoT. (25) The representation in (22) is called the Fourier Series. To illustrate pictorially the representation in (22), we have shown in Fig. , a triangular function and some of the components from the expansion. A continuous Signal x(t) defined for t between - 01 and 00 also possesses another Fourier representation called the continuous Fourier transform and defined by X(w) = j;, x(t)e-j* dt. (26) One can show that this relationship may be inverted to yield X(t) = & jy, X(o)ejwl do. (27) Comparing (22) and (27), we see that in both representations, x(t) has been expressed as a sum of sinusoids, e jwr; the difference being that in the former, the frequencies of the sinusoids are at multiples of wg, whereas in the latter we have all frequencies between - 03 to m.