Transcription of 2010: FRACTURE BEHAVIOR OF COARSE GRAIN …
1 1 FRACTURE BEHAVIOR OF COARSE GRAINGRAPHITES INVESTIGATED BY ACOUSTIC-EMISSION AND CT-ANALYSIST homas K ck1, Wolfgang Skopalik2, Markus G. R. Sause2,Siegfried Horn21 SGL Carbon GmbH, Werner-von-Siemens-Strasse 18,D-86405 Meitingen/Germany2 Universit t Augsburg, Universit tsstra e 1, D-86159 Augsburg/GermanyIntroductionFracture mechanics investigations on graphites with grainsizes larger than 10 mm are difficult to evaluate due toproblems with crack length measurement. Methods likecompliance, optical or direct current potential drop methodwhich are successfully used in the field of material science arenot applicable due to the macrostructure of these graphites andrequired sample sizes.
2 A combination between acoustic-emission and computer tomography (CT) analysis is used inthis paper to characterize the sample microstructure underloading and crack this paper three different trial materials with a COARSE grainrecipe are used:1. Trial recipe 1, max. GRAIN size around 10 mm2. Trial recipe 2, max. GRAIN size around 15 mm3. Trial recipe 3, max. GRAIN size up to 20 mmBesides coke and pitch an anti puffing agent is added to themix of all three materials. This addition forms smallprecipitations while the production material properties include an apparent density of g/cm3, dynamic Young s moduli of around 9 GPa andflexural bending strengths of to 10 MPa (4-point bending).
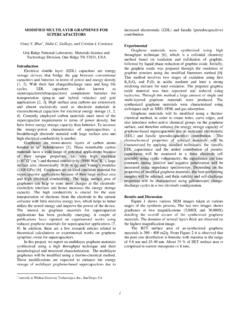
3 The average sound velocity of all three trial recipes is around1200 the FRACTURE experiments the sample geometry is a single-edge notched beam (SENB) where W = 70 mm, B = 70 mmand L = 490 mm (Fig. 1). With respect to the GRAIN size ( up to 20 mm) the notch length a0 is only 7 mm whichcorresponds to an a0/B ratio of . The notch is set with aband-saw with a 2 mm emission measurementAcoustic emissions are recorded using a 6-channel PCI-2system (Physical Acoustics) and a pre-amplification of 40 dBwith a threshold of 35 dB. To filter background noise andambient noise a band pass between 20 kHz 1 Mhz is total six WD wide-band sensors (Physical Acoustics) areused to detect the acoustic emissions.
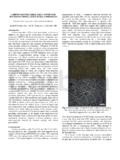
4 Vacuum cups which arecontinuously evacuated during the experiment are used to fixthe sensors on the sample surface. The recorded acousticemissions hits are localized by the software PolarAE andvisualized by the software "DensityVille" [1,2].Fig. 1 Vacuum punch to fix the sensors at the sample surface(a); schematic view of the experimental setup and the usedsample size (b)3-point bending measurementFigure 1b shows a schematic view of the experimental cross head speed of the testing machine is mm/swith a constant feed. The optical measurement of the crackpropagation is done by video capturing. The designated crackarea is coated with a white paint to increase the contrastbetween the crack and the sample and DiscussionMicrostructureCT-analysis clearly documents the differences between thethree materials (Fig.)
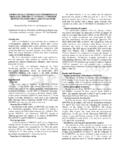
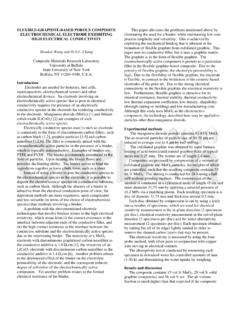
5 2). It is a very valuable tool to describeand to optimize the micro-/macrostructure of the coke grains with their porous and needle-shaped structureare clearly visible. By moving through the sample their three-dimensional orientation in the graphite block can additionallybe investigated which is a big advantage when compared toclassical micrographs. For each recipe the bigger coke grainsare very well embedded in the fine-grained matrix neithercavities nor gaps can be contrast, the distribution of the precipitations, seen as whitespots in the CT-pictures is not very homogenous. Furthermoresmall micro-cracks are visible, especially in the trial 1 material(Fig.
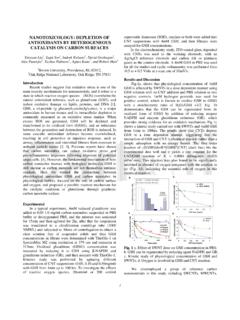
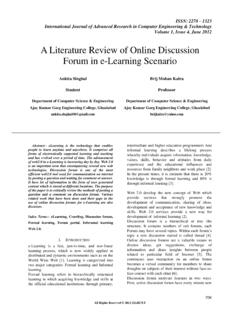
6 2a) distributed across the graphite block.(a)(b)2 Fig. 2 Microstructure of the three different COARSE graingraphite recipes; trial recipe 1 (a); trial recipe 2 (b); trial recipe3 (c)Acoustic emission combined with CT-analysisThe combination of acoustic emission density plots and CT-analysis yields a very good insight on the FRACTURE process andthe loaded microstructure. Figure 3 shows three slices throughthe FRACTURE surface profile of the trial material 3 with thecorresponding acoustic emission density. The CT-analysis isoverlaid by the acoustic emission densities at the samedistance referred to the sample general the pictures show a very broad distribution of theacoustic emissions around the crack path.
7 Sliding and partiallyexpanding micro-cracks during the loading process combinedwith the COARSE microstructure are responsible for thisbehavior. This can been seen for all three material types. Thewidth of this process zone can reach 15 mm around thecrack path. The knowledge of the process zone dimensionscould further be used to optimize the modeling of fractureprocesses of a COARSE GRAIN 3 Combination of acoustic emission density plots withthe CT-analysis; distance of the slice from the sample surface:25 mm (a); 40 mm (b); 50 mm (c)Precipitations are obviously sources of high acoustic emissiondensities (green to red color).
8 These parts emit acoustic signalseven if the distance between crack path and precipitationexceeds 20 mm (Fig 3b). Furthermore a network of acousticemissions between the precipitation can be observed (Fig 3c).These results show that the major part of the external loadingenergy dissipates at these precipitations. A better distributionof these particles combined with a smaller size could lead to abetter material performance under mechanical loads due toreduction of stress contrast, the large coke grains itself show almost noacoustic emissions even if they are embedded directly besidethe crack path (Fig 3a arrow).
9 At the edge of these biggergrains (>10 mm) a slightly increased acoustic emission densitycan be found which represents a good adhesion of coke grainsto graphite observations are made independently for all three trialmaterials with a similar amount of acoustic emissions andacoustic emission length measurementAcoustic emission measurements are also used to determinethe crack propagation length [3, 4]. This method is alsoapplicable for the tested COARSE GRAIN the initial crack length a0 and the final crack lengthatotal which corresponds to a complete crack through thesample, the crack propagation can be estimated by followingequation: = NiitEta0)()(where Ei represents the acoustic emission energy.
10 The cracklength in turn can be used to calculate FRACTURE properties likeK1c [4].ConclusionsThe method of combined acoustic emission measurement andCT-analysis is successfully used for COARSE GRAIN graphites todescribe the events happening during a FRACTURE process. Thiscombination connects the microstructure of the sampledirectly to the acoustic emissions and leads therefore to abetter understanding of the FRACTURE the crack propagation length can be determinedwhich is hardly accessible with commonly used techniqueslike compliance or potential drop [1] Rosenbusch N, Kurz J, Finck F. PolarAE. Operation [2] Skopalik W, Sause MGR.