Transcription of 2013 National Survey of Problem Gambling Services
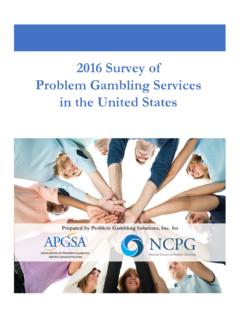
1 2013 National . Survey OF Problem . Gambling Services . March 2014 Prepared by Problem Gambling Solutions, Inc. A Prepared for: This study has been funded by the Association of Problem Gambling Service Administrators (APGSA). and the National Council on Problem Gambling (NCPG). For further information about the APGSA, contact: The project was conducted Mark Vander Linden under a contract between the President APGSA and Problem Association of Problem Gambling Service Gambling Solutions, Inc. Administrators 617-979-8445. For further information about the NCPG, contact: Acknowledgements Keith S. Whyte Survey Respondents: Executive Director We are grateful to all the state National Council on Problem Gambling agency administrators and 730 11th Street, NW, Suite 601 NCPG affiliate directors and Washington, DC 20001 staff who completed a Survey or helped in the gathering of x 23.
2 Survey information. For further information about this study, contact the Project Executive Team: Principle Investigator: Jeff Marotta, Mark Vander Linden, Chris Armentano, &. Jeffrey Marotta, Keith Whyte Problem Gambling Solutions, Inc., (503) 706-1197 Research Assistants: Ashley Reynolds, Monica Bahan, Emma Burick, Gail The views and conclusions expressed in this report are Calcagno, Jasmine Marotta- the authors and do not necessarily represent those of Jaenecke the APGSA or the NCPG. NCPG Work Group Participants: Suggested Citation: Don Feeney, Wily Harwell, Marotta, J., Bahan, M., Reynolds, A., Vander Carol O'Hare Linden, M.
3 , & Whyte, K. (2014). 2013 National Survey of Problem Gambling Services . Washington DC: National Council on Problem Gambling . ii TABLE OF CONTENTS. Section Page List of State Profiles iv List of Tables and Figures vi Executive Summary viii Introduction 1. Survey Methodology 3. Legalized Gambling in the 9. Funding for Problem Gambling Services 12. Types of Problem Gambling Services Funded 20. Administrative Structures 25. Problem Gambling Helplines 29. Treatment Systems 34. Research and Evaluation 44. Service Gaps & Infrastructure Needs 46. Associations between Variables of Interest: Statistical Explorations 48.
4 References 57. Appendix A: State Profiles 58. Appendix B: Contact Information by State 110. Appendix C: APGSA Survey Instrument 126. Appendix D: NCPG Affiliate Survey Instrument 144. iii STATE PROFILES. State Page Alabama 59. Alaska 60. Arizona 61. Arkansas 62. California 63. Colorado 64. Connecticut 65. Delaware 66. District of Columbia 67. Florida 68. Georgia 69. Hawaii 70. Idaho 71. Illinois 72. Indiana 73. Iowa 74. Kansas 75. Kentucky 76. Louisiana 77. Maine 78. Maryland 79. Massachusetts 80. Michigan 81. Minnesota 82. Mississippi 83. iv Missouri 84. Montana 85. Nebraska 86. Nevada 87. New Hampshire 88.
5 New Jersey 89. New Mexico 90. New York 91. North Carolina 92. North Dakota 93. Ohio 94. Oklahoma 95. Oregon 96. Pennsylvania 97. Rhode Island 98. South Carolina 99. South Dakota 100. Tennessee 101. Texas 102. Utah 103. Vermont 104. Virginia 105. Washington 106. West Virginia 107. Wisconsin 108. Wyoming 109. v LIST OF TABLES AND FIGURES. Figure Page Figure 1. Consumer Spending: Fiscal Year 2012 Lottery Sales, 2012 Casino Revenue, 2011 Tribal Gaming Revenue by State 11. Figure 2. 2013 Per Capita Allocation for Problem Gambling Services by States 13. Figure 3. Comparison between 2010 and 2013 : Per Capita Allocation on Problem Gambling Services 14.
6 Figure 4. 2013 Per Capita NCPG State Affiliate Budget 15. Figure 5. Combined 2013 Per Capita Problem Gambling Services Allocation by States and NCPG State Affiliates 16. Figure 6. Annual Aggregate of State Spending Dedicated for Problem Gambling Services 17. Figure 7. Annual Aggregate Budget of State Affiliates to the NCPG 18. Figure 8. Comparison of Prevalence and Public Funding for Substance Use Disorders and Gambling Disorders in the 19. Figure 9. Number of State Agencies and NCPG Affiliates Allocating Funding or Specific Problem Gambling Services 21. Figure 10. State Budget Allocations by Service Category in FY2013 22.
7 Figure 11. NCPG Affiliate Budget Allocations by Service Category in 2013 29 State Affiliates Reporting 24. Figure 12. Number of State FTE Positions Dedicated to PGS 37 States Reporting 26. Figure 13. Number of NCPG Affiliate FTE Positions Dedicated to PGS 34 Affiliates Reporting 27. Figure 14. Helpline Services 31. Figure 15. Helpline Call Volume and Calls for Help 32. Figure 16. Calls for Help Compared to Treatment Enrollments 33. vi Figure 17. Numbers Treated with Problem Gambling Funds SFY 2012 35. Figure 18. Over the past year, has the number of consumers receiving outpatient publicly funded Gambling treatment increased, decreased, stayed the same?
8 Response Comparison between 2010 Survey and 2013 Survey 36. Figure 19. Levels of Care Offered 37. Figure 20. Reimbursement Rates for State-Funded Treatment: Fiscal Year 2013 39. Figure 21. Cost Containment Measures 41. Figure 22. Numbers Treated by NCPG Affiliates 42. Figure 23. Identified Gaps in Services Responses to the question: What is you state's largest gap in Problem Gambling Services ? 46. Figure 24. Infrastructure Needs 47. Figure 25. Correlation between State Gaming Revenues and Problem Gambling Service Funding 50. Figure 26. Relationship between the Number of Legalized Types of Gambling within State and Problem Gambling Service Funding 50.
9 Figure 27. Relationship between a State's Estimated Number of Adult Problem Gamblers and Problem Gambling Service Funding 51. Figure 28. Relationship between Number of Types of Legalized Gaming Within a State and Problem Gambling Helpline Calls for Help 53. Figure 29. Relationship between Number of Estimated Adult Problem Gamblers within a State and Calls for Help to a Problem Gambling Helpline 54. Figure 30. Relationship between Problem Gambling service funding and numbers treated 55. vii 2013 National Survey of Problem Gambling Services EXECUTIVE SUMMARY. The present report describes the most comprehensive collection of information ever gathered about Problem Gambling Services in the United States.
10 Unlike other mental health and addiction Services , there is the absence of a federal agency designated to fund and guide programs and policies addressing Problem Gambling ; this has contributed to the need for non-governmental entities to gather National data to better inform individual state efforts and track National trends. The Association of Problem Gambling Service Administrators (APGSA) was formed in 2000 to support the development of Services that will reduce the impact of Problem Gambling . Central to this mission, the APGSA began sponsoring National Problem Gambling service surveys in 2006.
