Transcription of 2013 New York State Common Core Test Results: New York ...
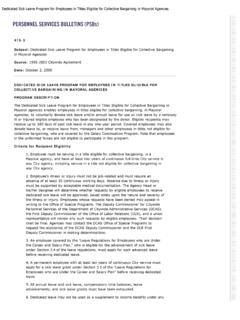
1 August 2013 2013 New york State Common core Test results : New york city Grades 3 8 1 Average annual income based on education levels High School Dropout $23,088 High School Diploma $32,552 2-year College Degree $39,884 4-year College Degree $53,976 Professional Degree $83,720 College and Careers are More Important Than Ever for Today s Students Sources: Department of Labor, Bureau of Labor Statistics, 2011. ACT, The Condition of College and Career Readiness, 2012. Previous New york State (NYS) tests measured whether students were on track for high school graduation, not whether they were ready for college In 2010, NYS joined other states in adopting the Common core standards defining what students need to know and be able to do at each grade level to graduate ready for college Students who are successful in college are better prepared for 21st-century careers, and most of the fastest-growing 21st-century jobs require a postsecondary degree Nationally.
2 Just 25% of high school students are ready for college and careers 2 The Common core Sets a High Bar for the Skills Students Need to Be College and Career Ready Kentucky, 2012: Elementary school proficiency dropped 58% Florida, 2012: 4th grade writing proficiency dropped 54% Tennessee, 2010: Elementary school proficiency dropped 67% Other states Have Begun to Transition to More Rigorous tests 3 Sources: Florida data - Herald Tribune: Kentucky data - Kentucky State Dept. of Education: Tennessee data - Times Free Press: 2010 2013 A group of 6 people at an elementary school gave a total of $1,890 to a town to fix up a playground.
3 Each person gave the same amount. At a middle school, 5 people each gave $280 to the same town. How much more did each person at the elementary school give than each person at the middle school? Show your work. The narrator s relationship with her grandmother develops during her visit. How does their relationship develop? How do they communicate even though they do not speak the same language? Use details from the story to support your response. In your response, be sure to: explain how their relationship develops explain how they communicate use details from the story to support your response Students read a text about a girl getting to know her grandmother during a visit to her home country.
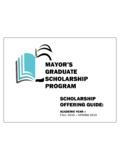
4 New 4th-grade State Test Questions Are More Rigorous A: 1/2 C: 2/3 B: 1/4 D: 2/5 The diagram below shows a rectangle divided into equal sections. What fraction of the rectangle is shaded? This story is mostly about how: A: being good at sports takes practice B: playing sports with a friend can be fun C: being an athlete means trying many sports D: playing sports is better than watching sports Students read a text about a bear playing sports. On this year s math tests , students had to solve more problems that included multiple steps and could not be determined by one, simple calculation.
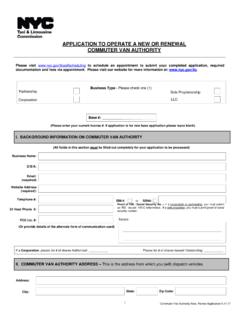
5 This year s English tests included texts that were on grade-level and had more rigorous vocabulary words; students needed to be able to cite evidence to support their answer, not just share their opinion. MATH ENGLISH 4 NAEP2003 NAEP2011 NYC2013On Similarly Rigorous tests , NYC Students Show Gains Over Time * Scores represent an average of 4th and 8th grade results from students sampled that year. MATH ENGLISH NAEP2003 NAEP2011 NYC2013 NAEP* The National Assessment of Educational Progress (NAEP) tests are more rigorous and Common core -aligned than the previous NYS tests and therefore provide an approximation of how NYC has performed over time when held to the higher standard 3-8 Grade NYS Common core NAEP 2003 to NYS Common core 2013 Gains: + NAEP* 3-8 Grade NYS Common core NAEP 2003 to NYS Common core 2013 Gains.
6 + 5 Percent of All NYC Students At or Above Proficient on the New NYS Common core tests and NAEP NAEP 2003 NAEP 2011 NAEP 2003 NAEP 2011 NYCB uffaloRochesterSyracuseYonkersNYSNew york city Outperformed Other Large Urban Districts in New york State 3-8 GRADE MATH NYCB uffaloRochesterSyracuseYonkersNYS3-8 GRADE ENGLISH New york city s deep commitment to training teachers and investing in preparing students for college and careers is showing success 6 Percent of Students At or Above Proficient on the New NYS Common core tests , by city and NYS 20062007200820092010201120122013 NYC Has Nearly Closed the Gap with NYS 7 2006 2013 NYC-NYS Gap Decrease: 2006 2013 NYC-NYS Gap Decrease: Notes: In 2010, NYSED increased the scale score required to meet each of the proficiency levels.
7 In addition, since 2011, NYSED increased the number of questions on the exam. 200620072008200920102011201220133-8 GRADE MATH 3-8 GRADE ENGLISH Difference In % Proficient Between All NYS and NYC Has Decreased Significantly Over Time 3-8 GRADE MATH 3-8 GRADE ENGLISH 2012 % Proficient 2013 % Proficient Point Change 2012 % Proficient 2013 % Proficient Point Change New york city New york city New york State New york State NYC Students Consistently Rise to the Challenge of Higher Standards Notes: In 2010, NYSED increased the scale score required to meet each of the proficiency levels.
8 In addition, since 2011, NYSED increased the number of questions on the exam. 3-8 GRADE MATH 3-8 GRADE ENGLISH 20062007200820098 Percent of All NYC Students At or Above Proficient On the Prior NYS tests NYS Increased Test Cut Scores in 2010 NYS Introduced New 3-8 tests in 2006 NYS Increased Test Cut Scores in 2010 NYS Introduced New 3-8 tests in 2006 3rd4th5th6th7th8th3 - 3rd4th5th6th7th8th3 - 82013 Proficiency of NYC Students in Math and English, by Grade MATH ENGLISH 9 The 2013 NYS Common core tests Represent a New Baseline for Our Students Percent of NYC Students At or Above Proficient 2013 Proficiency of NYC Traditional, Charter, and Peer Schools 3-8 GRADE MATH 3-8 GRADE ENGLISH NYCT raditionalNYC CharterSchoolsPeer Schoolsto NYCT raditionalNYC CharterSchoolsPeer Schoolsto NYCC hartersPercent of NYC Students At or Above Proficient on the New NYS Common core tests 10 Note: NYC traditional schools include all district schools and do not include charter schools.
9 Charter Schools Outperform Peer Schools Serving Similar Students NYC Students Outperformed Students in NYS Across Student Groups 3-8 GRADE MATH 11 Percent of All NYC and NYS Students At or Above Proficient on the New NYS Common core tests NYCNYSNYCNYSNYCNYSELLF ormer ELLS tudents withDisabilitiesNotes: Former ELL includes any students who were classified as English Language Learners in at least one of the previous two school years. 3-8 GRADE ENGLISH NYC Students Outperformed Students in NYS Across Most Student Groups 12 Percent of All NYC and NYS Students At or Above Proficient on the New NYS Common core tests NYCNYSNYCNYSNYCNYSELLF ormer ELLS tudents withDisabilitiesNotes: Former ELL includes any students who were classified as English Language Learners in at least one of the previous two school years.
10 Information for Families Individual student score results will be available on ARIS Parent Link starting the week of August 26 through Forgot your password? Visit and click Password Help Never been on ARIS Parent Link? Need computer access? Contact your school or attend Log on & Learn Week From August 26-30, DOE officials will be stationed at libraries across all five boroughs to help families Log on & Learn 13 Search for Common core Parent Resources to watch a video from Chancellor Walcott, find a set of tips for talking with your child, and read an FAQ on the 2013 State Common core tests Students, Teachers.