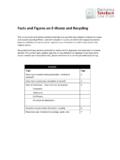
Transcription of 2015 Memphis Poverty Fact Sheet
1 Elena Delavega, Department of Social Work, School of Urban Affairs and Public Policy, university of Memphis 2015 Memphis Poverty Fact Sheet 1 2015 Memphis Poverty Fact Sheet (Data from 2014 ACS) Who are the Memphis Poor? Memphis has a Poverty rate of Child Poverty is , while Poverty rates for people over age 65 are the lowest at Poverty rates for Blacks are , and of Latinos are poor, while the Poverty rate among non-Hispanic Whites is The Poverty Rate in Memphis and Shelby County Compared to National Rates In general, Poverty rates for the City of Memphis are higher than Poverty rates in Shelby County for every category. Both are higher than Poverty rates in Tennessee, and Tennessee Poverty rates are higher than Poverty rates in almost every category (racial and ethnic groups, and age groups).
2 The exception to this is the Poverty rate for non-Hispanic Whites, which is lower in Shelby County than elsewhere. However, Poverty rates for non-Hispanic whites are higher in Memphis and Shelby County than in 2013. Table 1 Diverse Poverty Rates in Memphis , Shelby County, Tennessee, and the United States 2013 Poverty Rate Overall Under 18 18-64 Over 65 Non-Hispanic White Black Latino Asian Memphis Shelby County Tennessee United States Elena Delavega, PhD, MSW Assistant Professor Department of Social Work School of Urban Affairs and Public Policy 223 McCord Hall Memphis , TN 28152 Elena Delavega, Department of Social Work, School of Urban Affairs and Public Policy, university of Memphis 2015 Memphis Poverty Fact Sheet 2 New in 2015 Poverty has caught up with non-Hispanic Whites.
3 Poverty rates among the members of this group have increased dramatically in both Memphis and Shelby County. Not-So-New in 2015 For the second year in a row, while Poverty rates have declined for the , they have increased in Memphis , Shelby County, and Tennessee. Poverty rates in Memphis and Shelby County are higher than Poverty rates for the United States and for Tennessee. Good News for Latinos In Memphis and Shelby County as in the United States as a whole, Poverty rates among Latinos decreased. It is too early to conclude that this is a trend, however. This may indicate a positive trend, or it may just be the result of a statistical anomaly. Figure 2 Poverty Rates in 2013 and 2014 in Memphis and Shelby County Chart by the author from data from the 2013 and 2014 ACS 1-Y Estimates (Tables C01001 and C17001), September 17, 2015.
4 Figure 1 Percent of the Population under Poverty Chart by the author from data from the 2013 and 2014 ACS 1-Y Estimates (Tables C01001 and C17001), September 17, 2015. Elena Delavega, Department of Social Work, School of Urban Affairs and Public Policy, university of Memphis 2015 Memphis Poverty Fact Sheet 3 Figure 3 Percent Change in Poverty Rates Tables 2-4 Poverty Rates by Age, Race, and Location The Intersection of Age and Race Memphis City Shelby County All Ages Under 18 18-64 65+ All Ages Under 18 18-64 65+ All Races non-Hispanic White Black Latino N/A N/A The Intersection of Age and Race Tennessee United States All Ages Under 18 18-64 65+ All Ages Under 18 18-64 65+ All Races non-Hispanic White Black Latino Memphis , TN-MS-AR Metro Area All Ages Under 18 18-64 65+ Non-Hispanic White Black Latino Asian Chart by the author from data from the 2013 and 2014 ACS 1-Y Estimates (Tables C01001 and C17001), September 17, 2015.
5 Elena Delavega, Department of Social Work, School of Urban Affairs and Public Policy, university of Memphis 2015 Memphis Poverty Fact Sheet 4 Poverty Rankings In 2014, Memphis retained the unfortunate top spot in both overall and child (under 18) Poverty rates among Metropolitan Statistical Areas (MSA) with populations greater than 1,000,000, a rather unsavory achievement. When including MSA with populations greater than 500,000, Memphis has shown an increase in overall Poverty rates, moving from fourth place to third. Worse still, even as child Poverty rates continue to decline at the national level, the child Poverty rate in Memphis has increased. Memphis appears to have lost ground in every case, getting closer to the first spot in every demographic category (cities over 500,000, MSA over 500,000, and MSA over 1,000,000).
6 The rank number denotes the position of a city or MSA relative to others. The higher the rank number, the higher the Poverty rate for that locality. In other words, a higher ranking is not desirable. Rank change denotes the number of spots a city or MSA has moved up or down in the rankings. Table 5 Memphis Rank in Poverty Rates Memphis 2013 2014 Poverty Rate Poverty Rank Poverty Rate Poverty Rank Rank Change % Change Among Cities with Populations Greater than 500,000 (34 Cities) Overall 4th 3rd 1 Under 18 3rd 2nd 1 Among MSA with Populations Greater than 500,000 (104 MSA) Overall 10th 6th 4 Under 18 7th 5th 2 Among MSA with Populations Greater than 1,000,000 (52 MSA)
7 Overall 1st 1st ---- Under 18 1st 1st ---- Table 6 Highest Poverty Rates in Cities and MSA in the United States Highest Poverty Rates Rank 1 2013 2013 Rank 1 Poverty Rate Rank 1 Poverty Rate Rank Change % Change Among Cities with Populations Greater than 500,000 (34 Cities) Overall Detroit city, Michigan Detroit city, Michigan ---- Under 18 Detroit City, Michigan Detroit City, Michigan ---- Among MSA with Populations Greater than 500,000 (104 MSA) Overall McAllen-Edinburg-Mission, TX Metro Area McAllen-Edinburg-Mission, TX Metro Area 34% ---- Under 18 McAllen-Edinburg-Mission, TX Metro Area McAllen-Edinburg-Mission, TX Metro Area ---- Among MSA with Populations Greater than 1,000,000 52 MSA) Overall Memphis , TN-MS-AR Metro Area Memphis , TN-MS-AR Metro Area ---- Under 18 Memphis , TN-MS-AR Metro Area Memphis , TN-MS-AR Metro Area ---- Elena Delavega, Department of Social Work, School of Urban Affairs and Public Policy, university of Memphis 2015 Memphis Poverty Fact Sheet 5 What the Rankings Mean The cities and MSA that ranked first in overall and child (under 18)
8 Poverty rates retained their dubious first places. However, Poverty rates in general did not increase or decrease. The exception was the child (under 18) Poverty rate in the Memphis MSA (among MSA with populations over 1,000,000), which increased 3% from 2012 to 2013, a disheartening fact given the direction of other Poverty rates. Memphis Has the Highest Poverty Rates, But Not for Everyone The Relationship between Poverty and Race It has now been observed for several years that the Poverty rate among non-Hispanic Whites only is much lower in Shelby County than in the state or the nation as a whole. Although in 2014 the Poverty rate for non-Hispanic Whites increased both in Memphis and Shelby County, the Poverty rate for this group continues to be lower in Shelby County than in the rest of the nation.
9 It is important to note, however, that the Poverty rate for this group is also bucking the national trend and increasing. Poverty rates for Blacks and Latinos are dropping nationwide even as they have increased in Tennessee. The poor in Memphis tend to be minorities. The Poverty rates for Blacks and Latino are higher than the overall Poverty rate, and Poverty rates for minorities are higher in every age category than Poverty rates for non-Hispanic Whites. Moreover, Poverty rates for non-Hispanic Whites are lower in Memphis and Shelby County than in Tennessee as a whole or the United States in every age category. Table 7 Comparison of Poverty Rates and Poverty Trends for non-Hispanic Whites Only and Blacks Only Memphis non-Hispanic Whites Only 2014 Overall Poverty Rate Overall Poverty Rank non-Hispanic White Poverty Rate non-Hispanic White Poverty Rank Among Cities with Populations Greater than 500,000 (34 Cities) 3rd 10th Among MSA with Populations Greater than 500,000 (104 MSA) 6th 63th Among MSA with Populations Greater than 1,000,000 (52 MSA) 1st 25nd It is very interesting to note that while Memphis ranks first among large metro areas (population greater than 1,000,000), when the Poverty rate for non-Hispanic Whites is considered by itself, Memphis ranks much lower.
10 The differences between the Poverty rates of minority groups and non-Hispanic Whites are striking. Elena Delavega, Department of Social Work, School of Urban Affairs and Public Policy, university of Memphis 2015 Memphis Poverty Fact Sheet 6 Figures 4-5 Comparison of Poverty Rates and Poverty Trends for non-Hispanic Whites Only and Blacks Only Trends in Poverty Rates The Poverty rates for non-Hispanic Whites are better in Memphis and Shelby County than for the same group in Tennessee or the United States, while the rates for Blacks are worse. It is also interesting to note that for non-Hispanic Whites, the worst Poverty rates are at the state level.