Transcription of 2016 Annual Incentive Plan Report - FW Cook
1 January 2017. 2016 Annual Incentive plan Report 2016 Annual Incentive plan Report . Table of Contents Introduction 1. Executive Summary 3. Annual Incentive Award Pool Funding 4. Non-Discretionary Annual Incentive Plans Financial Measures 6. Non-Financial Measures 8. Performance Modifiers 9. Weighting of Measures 10. Annual and Long-Term Overlapping Measures 12. Discretionary Annual Incentive Plans 13. Other Annual Incentive Practices Annual Incentive Payout Leverage (Maximum Payout Opportunity) 14. Actual Annual Incentive Payouts 14. Foreign Currency Adjustments 15. Appendix Companies Included in the 2016 Annual Incentive plan Report 16. Company Profile & Authors 19. i 2016 FW Cook INTRODUCTION. Overview and Methodology This Report presents information on Annual Incentive plan practices in place for executives at the 250 largest companies in the Standard & Poor's 500 Index.
2 The Top 250 companies, limited to those granting Annual incentives , are selected based on market capitalization, , share price multiplied by total common shares outstanding as of March 31, 2016 , as reported by Standard & Poor's Capital IQ (see Appendix for the complete list of companies). The table below profiles the industry sectors represented in the Top 250 in 2016 , as defined by Standard & Poor's Global Industry Classification Standard ( GICS ). Industry Sector (# of companies) Percent of Annual Market TSR(1) TSR(1) 5-Year sorted by prevalence Companies Sales ($B) Cap. ($B) 1-Year CAGR(2). Health Care (39) 16% $ $ 3% 21%. Financials (35) 14% $ $ 7% 19%. Information Technology (33) 13% $ $ 26% 21%. Consumer Discretionary (31) 12% $ $ 6% 22%.
3 Consumer Staples (29) 12% $ $ 17% 17%. Industrials (29) 12% $ $ 19% 19%. Utilities (15) 6% $ $ 17% 12%. Energy (14) 6% $ $ 19% 8%. Real Estate (13) 5% $ $ 19% 18%. Materials (9) 4% $ $ 22% 21%. Telecommunication Services (3) 1% $ $ 25% 13%. Total Top 250 - Median $ $ 16% 19%. *Market Data is provided by S&P Capital IQ and is as of 9/30/16 **Market Data depicts median amount (1). TSR = Total Shareholder Return, a measure of stock price and dividend performance (2). CAGR = Compounded Annual Growth Rate 1. 2016 FW Cook INTRODUCTION. Survey Scope This Report covers the following topics: Annual Incentive award pool funding Annual Incentive measure design features, including number of measures, types of measures, weighting of measures, performance modifiers and the prevalence of Annual Incentive measures that overlap with long-term Incentive measures Annual Incentive maximum payout opportunities Actual Annual Incentive payouts for the CEO for the latest fiscal year Performance measure adjustments for the impact of foreign currency fluctuations in Annual Incentive plans Source of Data All information was obtained from public documents filed with the Securities and Exchange Commission ( SEC ), including proxy statements and 8-K filings.
4 2. 2016 FW Cook EXECUTIVE SUMMARY. Annual Incentive plans play a key role in motivating and focusing employees on a company's short-term goals. Key considerations for designing an Annual Incentive plan are selecting the appropriate performance measures and deciding how they should be weighted. Effective Annual Incentive measures will provide a clear line-of-sight to the overall strategy of the company and/or a participant's impact on performance. Although there are many ways to structure Annual Incentive plans, some common themes in Annual Incentive design among the Top 250 companies are observed: Eighty-three percent of companies in the Top 250 use at least one specific financial measure to determine Annual Incentive payouts, of which 75% use two or more financial measures.
5 Non-financial measures ( strategic and individual performance) are also common and are used as a stand-alone measure by 52% of companies with non-discretionary plans. Profitability measures are not only the most prevalent Annual Incentive measures (utilized by 92% of companies with non-discretionary plans), but profitability measures also carry the heaviest weighting among the companies that use them (on average, comprise 59% of the weighting of Annual Incentive plans among those that use them). Among companies with heads of business units reported in their proxy statements, the dominant practice is to emphasize corporate over business unit results for these officers. Sixty-two percent of companies in the Top 250 provide a maximum Annual Incentive payout opportunity of 200% of target, with the remainder divided approximately equally above and below 200%.
6 Although company strategy plays a large role in shaping Annual Incentive plan design, external forces are also playing an increasingly important role. As proxy advisory firms and institutional investors continue to emphasize a pay-for-performance philosophy, companies face scrutiny when Annual Incentive payouts do not align with company performance. We see this manifested in plan design through the use of a portfolio of measures and the convergence around 200% of target as the standard maximum payout opportunity. However, despite outside pressure to transparently link pay directly to financial and/or stock price performance, over half of Top 250 companies use one or more non-financial measures in their Annual Incentive plans and 17% of companies maintain a plan that is determined entirely on a discretionary basis.
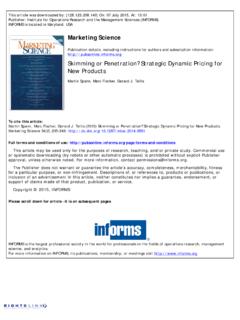
7 Investors also remain focused on the rigor of performance goals in Annual Incentive plans, as the median actual Annual Incentive payout was 120% of target for the Chief Executive Officer ( CEO ) during the latest reported fiscal year (generally 2015). Regulation has also impacted Annual Incentive plan design, most notably through the use of plan -within-a- plan funding approaches (disclosed at 42% of the Top 250 companies) as a way to comply with requirements under Internal Revenue Code ( IRC ) Section 162(m). 3. 2016 FW Cook Annual Incentive AWARD POOL FUNDING. Annual Incentive Pool Funding Prevalence of " plan -Within-A- plan " Methods 60%. " plan -Within-A- plan ". 42%. 49%. 50%. Percent of " plan -Within-A-Plans". 45%. 40%. 30%. Bottom-Up 20%.
8 58% 16%. 10%. 0%. Threshold/ Formula Other Gate Method While Annual Incentive plan design can be very specific to a particular company and its culture, in many cases, regulation also influences it. A notable example of this is in the use of a plan -within-a- plan approach for the funding of Annual Incentive plan awards or pools. This approach is typically used to provide some flexibility in determining individual Annual Incentive award payouts while maintaining compliance with IRC Section 162(m) restrictions that would otherwise limit deductibility of compensation to certain executive officers if specific requirements are not met (in particular, if the award is non-performance based or non-formulaic). 42% of the Top 250 companies disclose that they utilize a plan -within-a- plan funding approach, in which the maximum Incentive award or pool funding is determined first under what is often referred to as the umbrella plan , and then the actual award payout is determined through the Board's or Compensation Committee's ( Committee ) use of negative discretion.
9 Negative discretion is often exercised by applying the company's formulaic Annual Incentive plan design (30% of companies) or, the inside plan , but can also be based solely on the Committee's discretion (12% of companies). It is important to note that the prevalence of a plan -within-a- plan . approach may be understated as companies generally tend to focus their proxy statement CD&A disclosure on their operative plan that actually drives Incentive award payouts. 4. 2016 FW Cook Annual Incentive AWARD POOL FUNDING. The two main methods that companies use to determine the funding under an umbrella plan for a plan -within-a- plan . approach are (1) a threshold/gate and (2) a formula. Forty-nine percent of companies that use a plan -within-a- plan use a threshold/gate method, in which companies set a minimum level of objective performance as the basis to fund the maximum payout level for participants.
10 If the threshold is not met, no Annual Incentive awards are earned under the plan . As such, the threshold/gate is often set at a level that is substantially uncertain at the time of establishment but has a reasonable likelihood of achievement, with more challenging goals that are directly tied to the company's financial, operational or strategic priorities set under the inside plan . Forty-five percent of companies that use a plan -within-a- plan use a formula mechanism, in which the maximum payout level is determined as a fixed percentage of profit, either for each individual participant ( , 1% of net income for each executive officer) or in total for all participants ( , pool equal to 5% of net income, with allocation such that the sum of all participant awards cannot exceed 100% of the pool).