Transcription of 2016 Disability Statistics Annual Report
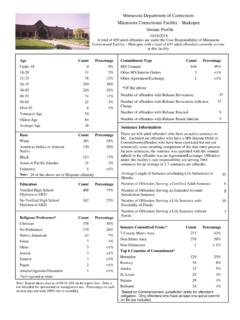
1 Institute on Disability /UCEDD isability Statistics Annual Report2016A Publication of the Rehabilitation Research and Training Center on Disability Statistics and DemographicsAcknowledgementsThis Report was prepared by Lewis Kraus, MPH, MCP at the Center on Disability at the Public Health Institute. Special thanks to the following individuals who have contributed to the success of this effort:Andrew Houtenville, PhD, Eric Lauer, MPH, Rachel Coleman, Penny Gould, Milan Hajek and John Matthew for this publication made possible by:The StatsRRTC is funded by the National Institute on Disability , Independent Living, and Rehabilitation Research (NIDILRR) under grant number 90RT5022-02-01, from 2013 - 2018. Suggested Citation: Kraus, Lewis. (2017). 2016 Disability Statistics Annual Report .
2 Durham, NH: University of New West Edge Drive, Suite 101 | Durham, NH | Relay: 711 | Fax: Stay Connected: January 2017. Institute on Disability . University of New Research and Training Center on Disability Statistics and DemographicsA NIDILRR-Funded CenterDisability Statistics Annual Report2016 Annual Report : 2016 | Disability Statistics & in the United With Disability in the US Across the Life Span ..7 Prevalence by Disability Type ..11 Percent Employed, Ages 18-64 ..15 Earnings ..19 Poverty ..23 Health ..27 Appendix A: The Six Disability Questions in the American Community B: Source C: Glossary of Terms ..38 About the StatsRRTC ..41 Table of ContentsAnnual Report : 2016 | Disability Statistics & Demographics1 The 2016 Disability Statistics Annual Report presents Statistics to address the following types of questions: How many people with disabilities live in the United States?
3 What is the percentage of people with disabilities in different age groups? What is the percentage of people with disabilities for different types of Disability ? To what extent are people with disabilities employed? What are the earnings for people with and without disabilities? What is the poverty percentage for people with and without disabilities? Is Disability status associated with percentages of smoking, obesity, and binge drinking?The Annual Report highlights state and trend data from national sources. A specific listing of source data for each figure is included in Appendix B. There is a great deal of variability in rates of people with disabilities by state and the Annual Report includes maps to highlight this information. A glossary of terms is included in Appendix Annual Report charts complement the detailed tables of data which can be found in the 2016 Annual Disability Statistics Compendium ( ).
4 | 2 The American Community Survey (ACS) estimates the overall rate of people with disabilities in the US population in 2015 was The percent of people with disabilities varies greatly by state, as do levels of people with disabilities in employment, poverty, earnings, and health behaviors. The percentage of people with disabilities in the US population rose from in 2010 to in 2013, 2014, and 2015. The state with the lowest percentage of people with disabilities in 2015 was Utah at ; the state with the highest percentage of people with disabilities, West Virginia, was almost twice as high with a percentage of Rates of Disability increase with age. In the US in 2015, less than of the under 5 years old population had a Disability .
5 For those ages 5-17, the rate was For ages 18-64, the rate was For people ages 65 and older, had a Disability . In 2015, of the US population with disabilities, over half ( ) were people in the working-ages of 18-64, while were 65 and older. Disability in children and youth accounted for only (ages 5-17) and (under 5 years old). All Disability types (hearing, vision, cognitive, ambulatory, self-care, and independent living) have increases in Disability percentages with age; cognitive disabilities show the least change between age groups. In 2015, of people with disabilities in the US ages 18-64 living in the community were employed compared to for people without disabilities - a gap of percentage points. The employment gap between those with a Disability and those without has widened steadily over the past 8 years from to percentage points.
6 There is state variation in the rates of employment for people with disabilities, from a high of in Wyoming to a low of in West Virginia; for people without disabilities, state employment rates ranged from a high of in Minnesota to a low of in Mississippi. In thirty states, the employment percentage gap between those with a Disability and those without was 40 percentage points or greater; only three states showed an employment percentage gap less than percentage points. Employment rates vary by type of Disability . Employment rates are highest for people with hearing ( ) and vision disabilities ( ) and lowest for people with self-care ( ) and independent living disabilities ( ).Quick FactsAnnual Report : 2016 | Disability Statistics & Demographics3 According to 2015 data, the median earnings of US civilians with disabilities ages 16 and over was $21,572, about two-thirds of the median earnings of people without disabilities ($31,874).
7 An earnings disparity of over $10,000 in median earnings between those with and without disabilities has existed since at least 2008. The disparity has increased in magnitude since 2013. States also varied widely in earnings gap in 2015 from a low of $4,490 in Nevada to a high of $24,073 in the District of Columbia. More than one in five ( ) US civilians with disabilities of working-age in 2015 were living in poverty. For US civilians of working-age without disabilities, the national poverty rate was The poverty percentage gap, or the difference between the percentages of those with and without disabilities, has been between and percentage points over the past 7 years. In 2015, states show an increasing poverty percentage gap between those with and without disabilities at all age groups except for people ages 65 and over.
8 The US rate of smoking for people with disabilities was in 2015, much higher than the rate of for people without disabilities. This gap of percentage points was a drop over the prior three years, where the gap was to points. In 2015, the US obesity rate for people with disabilities was For people without disabilities, the obesity rate was 2015 showed the first year-to-year drop in obesity gap since 2009 between the percentages of obesity for people with and without disabilities. For states, the 2015 gap in binge drinking for those ages 18 and over ranged from 13 points less (thus more people without disabilities binge drinking than those with disabilities) in North Dakota to points less in | 4 Annual Report : 2016 | Disability Statistics & in the United StatesHow many people with disabilities live in the United States?
9 According to the American Community Survey (ACS), an Annual survey conducted by the US Census Bureau, the overall percentage of people with disabilities in the US in 2015 was Disability is defined by the ACS as an affirmative response to one of six (6) questions. Appendix A provides detail on the definitions used in the ACS estimates.*FIG 1. Percentage of People in the US with Disabilities, 2008-2015*- Other surveys have publicized other rates of Disability . These rates are affected by survey question, method, and other factors. Each survey has strengths and weaknesses. Comparing Disability data between surveys is discouraged by all survey organizations. We have used the ACS due to its larger sampling, consistent year to year questions, and multitude of variables to examine.
10 Over the past years, the consistency of the Disability questions used in the survey allows for a look at the percentage of people with disabilities over time. Figure 1 shows that the percentage of those with a Disability in the US civilian population ranged from in 2010 to in 2013, 2014, and 2015. | Disability Prevalence. to to to to ACS provides estimates of people with disabilities in all states. This Annual Report shows data for states divided into four quartiles to show how states vary for different Disability -related topics. In 2015, the state with the lowest percentage of its population having a Disability was Utah ( ).The state with the highest percentage of Disability , West Virginia, was almost twice as high with a percentage of For the most part, higher percentages of Disability were clustered in the southern US, around the lower Mississippi river region, with concentrations also high in the states of Maine and Oregon (Figure 2).