Transcription of 2018 ENVIRONMENTAL PERFORMANCE INDEX - Yale …
1 2018 ENVIRONMENTAL . PERFORMANCE INDEX . Global metrics for the environment: Ranking country PERFORMANCE on high-priority ENVIRONMENTAL issues Yale Center for ENVIRONMENTAL Law & Policy, Yale university Center for International Earth Science Information Network, columbia university In collaboration with the World Economic Forum With support from The McCall MacBain Foundation and Mark T. DeAngelis FPO. EXECUTIVE SUMMARY DATA-DRIVEN METRICS. Careful measurement of ENVIRONMENTAL EPI are indicative of the need for national The world has entered a new era of trends and progress provides a foundation sustainability efforts on a number of data-driven ENVIRONMENTAL policymaking. for effective policymaking. The 2018 fronts, especially cleaning up air quality, With the UN's 2015 Sustainable ENVIRONMENTAL PERFORMANCE INDEX (EPI) protecting biodiversity, and reducing Development Goals, governments are ranks 180 countries on 24 PERFORMANCE GHG emissions.
2 Some of the laggards increasingly being asked to explain their indicators across ten issue categories face broader challenges, such as civil PERFORMANCE on a range of pollution covering ENVIRONMENTAL health and unrest, but others seem to be suffering control and natural resource management ecosystem vitality. These metrics provide the effects of weak governance. The EPI challenges with reference to quantitative a gauge at a national scale of how close draws attention to the issues on which metrics. A more data-driven and countries are to established ENVIRONMENTAL policymakers must take further action. empirical approach to ENVIRONMENTAL policy goals. The EPI thus offers a protection promises to make it scorecard that highlights leaders and While the EPI provides a framework for easier to spot problems, track trends, laggards in ENVIRONMENTAL PERFORMANCE , greater analytic rigor in ENVIRONMENTAL highlight policy successes and gives insight on best practices, and policymaking, it also reveals a number of failures, identify best practices, and provides guidance for countries that severe data gaps.
3 As the EPI project optimize the gains from investments aspire to be leaders in sustainability. has highlighted for two decades, better in ENVIRONMENTAL protection. data collection, reporting, and verification Innovations in the 2018 EPI data and across a range of ENVIRONMENTAL issues The overall EPI rankings indicate which methodology have generated new are urgently needed. The existing gaps countries are doing best against rankings founded on the latest advances are especially pronounced in the areas the array of ENVIRONMENTAL pressures in ENVIRONMENTAL science and analysis. of sustainable agriculture, water resources, that every nation faces. From a policy Switzerland leads the world based waste management, and threats to perspective, greater value derives on strong PERFORMANCE across most biodiversity.
4 Supporting stronger global from drilling down into the data to issues, especially air quality and climate data systems thus emerges as essential analyze PERFORMANCE by specific protection. In general, high scorers to better management of sustainable issue, policy category, peer group, and exhibit long-standing commitments development challenges. country. Such an analysis can assist to protecting public health, preserving in refining policy choices, understanding natural resources, and decoupling This Summary for Policymakers contains the determinants of ENVIRONMENTAL photographs: aleksandrowicz/us epa/naid 550179 (public domain), us blm (public domain), varodrig/wikimedia commons (cc by-sa ). greenhouse gas (GHG) emissions from a snapshot of the 2018 EPI's framework progress, and maximizing the return economic activity.
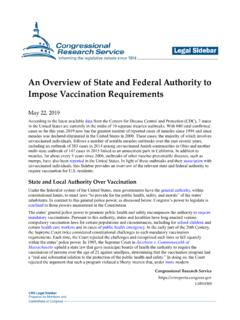
5 And results. Complete methods, on governmental investments. data, and results including for individual India and Bangladesh come in near the countries are available online at bottom of the rankings. Low scores on the TWO DIMENSIONS OF ENVIRONMENTAL PERFORMANCE . Ecosystem Vitality Switzerland Slovakia Finland China The relationship between Congo Regions sub-scores on the two policy USA Asia objectives for all 180 countries Caribbean in the 2018 EPI illustrate that E. Europe &. ENVIRONMENTAL Health and Eurasia Ecosystem Vitality are distinct India Europe &. dimensions of ENVIRONMENTAL N. America Burundi PERFORMANCE which may Haiti Latin America be in some tension as economic Mid East &. N. Africa growth creates resources Pacific to invest but adds to pollution Sub-Saharan burdens and habitat stress.
6 ENVIRONMENTAL Health Africa KEY FINDINGS. Air quality remains the leading With 20 years of experience, the EPI. ENVIRONMENTAL threat to public health. reveals a tension between two fundamen- In 2016 the Institute for Health tal dimensions of sustainable develop- Metrics and Evaluation estimated that ment: (1) ENVIRONMENTAL health, which diseases related to airborne pollutants rises with economic growth and prosperi- contributed to two-thirds of all life- ty, and (2) ecosystem vitality, which years lost to environmentally related comes under strain from industrialization deaths and disabilities. Air pollution and urbanization. Good governance issues are especially acute in rapidly emerges as the critical factor required urbanizing and industrializing nations to balance these distinct dimensions such as India and China.
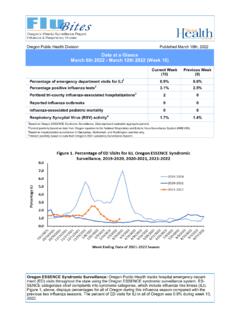
7 Of sustainability. The world has made great strides in protecting marine and terrestrial habitats, exceeding the international goal for marine protection in 2014. Additional indicators measuring terrestrial protected areas suggest, however, that more work needs to be done to ensure the presence of high-quality habitat free from human pressures. Most countries improved GHG emissions intensity over the past ten years. Three-fifths of countries in the EPI have declining CO2 intensities, while 85 90%. of countries have declining intensities for methane, nitrous oxide, and black carbon. These trends are promising yet must be accelerated to meet the ambitious targets of the 2015 Paris Climate Agreement. 2018 EPI FRAMEWORK. objectives: ENVIRONMENTAL ecosystem health (40%) vitality (60%).
8 Issues: Air Quality (65%) Water Quality (30%) Heavy Metals (5%) Biodiversity Forests (10%) Fisheries (10%) Climate & Energy (30%) Air Pollution (10%) Water Resources (10%) Agriculture (5%). & Habitat (25%). indicators: Marine Protected Tree Cover Loss (100%) Fish Stock Status CO2 Emissions SO2 Emissions (50%) Wastewater Sustainable Nitrogen Areas (20%) (50%) Total (50%) Treatment (100%) Management (100%). Exceedance (30%) Sanitation (50%) Lead Exposure (100%). Biome Protection Regional Marine CO2 Emissions NOX Emissions (50%). Global (20%) Trophic INDEX (50%) Power (20%). Exposure (30%) Drinking Water (50%). Biome Protection Methane Emissions National (20%) (20%). Species Protection N2O Emissions (5%). Household Solid Fuels (40%).
9 INDEX (20%). Representativeness Black Carbon INDEX (10%) Emissions (5%). Species Habitat INDEX (10%). The 2018 EPI Framework organizes 24 indicators into ten issue categories and two policy objectives. Weights used in each level of aggregation shown in parentheses. 2018 EPI RANKINGS. RANK COUNTRY SCORE REG RANK COUNTRY SCORE REG RANK COUNTRY SCORE REG. 1 Switzerland 1 61 Kuwait 5 121 Thailand 12. 2 France 2 62 Jordan 6 122 Micronesia 13. 3 Denmark 3 63 Armenia 17 123 Libya 16. 4 Malta 4 64 Peru 6 124 Ghana 11. 5 Sweden 5 65 Montenegro 18 125 Timor-Leste 14. 6 United Kingdom 6 66 Egypt 7 126 Senegal 12. 7 Luxembourg 7 67 Lebanon 8 127 Malawi 13. 8 Austria 8 68 Macedonia 19 128 Guyana 20. 9 Ireland 9 69 Brazil 7 129 Tajikistan 27.
10 10 Finland 10 70 Sri Lanka 6 130 Kenya 14. 11 Iceland 11 71 Equatorial Guinea 2 131 Bhutan 15. 12 Spain 12 72 Mexico 8 132 Viet Nam 16. 13 Germany 13 73 Dominica 5 133 Indonesia 17. 14 Norway 14 74 Argentina 9 134 Guinea 15. 15 Belgium 15 75 Malaysia 7 135 Mozambique 16. 16 Italy 16 76 Antigua and Barbuda 6 136 Uzbekistan 28. 17 New Zealand 1 77 United Arab Emirates 9 137 Chad 17. 18 Netherlands 17 78 Jamaica 7 138 Myanmar 18. 19 Israel 1 79 Namibia 3 139 C te d'Ivoire 18. 20 Japan 1 80 Iran 10 140 Gabon 19. 21 Australia 2 81 Belize 10 141 Ethiopia 20. 22 Greece 18 82 Philippines 8 142 South Africa 21. 23 Taiwan 2 83 Mongolia 9 143 Guinea-Bissau 22. 24 Cyprus 19 84 Serbia 20 144 Vanuatu 7. 25 Canada 20 84 Chile 11 145 Uganda 23.