Transcription of 2019 National Travel Survey - GOV.UK
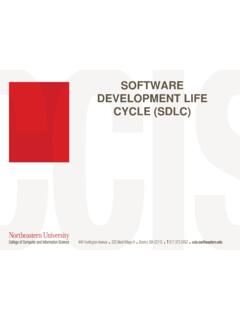
1 Statistical Release 5 August 20201 DWLRQDO 7 UDYHO 6 XUYH\ (QJODQG $ERXW WKLV UHOHDVHThe National Travel Survey is a household Survey of personal Travel by residents of England travelling within Great Britain, from data collected via interviews and a seven-day Travel diary, which enables analysis of patterns and trends.,Q WKLV SXEOLFDWLRQMain resultsp2 Introductionp4 Thank youp4 Accessing micro-level NTS datap4 Uses of the NTSp5 Recent NTS developmentsp6 User engagementp6 Factsheetsp7 Notes and background informationp87KH DYHUDJH QXPEHU RI DQQXDO WULSV WDNHQ E\ SHRSOH LQ (QJODQG GXULQJ LV FRPSDUDEOH WR WKH QXPEHU RI WULSV LQ IROORZLQJ D UHGXFWLRQ VLQFH WKH ODWH V )LJXUH 7 UHQGV LQ WULSV WDNHQ PLOHV WUDYHOOHG DQG KRXUV VSHQW WUDYHOOLQJ WDEOH 176 Most of the decrease in average trips since 2002 is due to a reduction in the number of car trips taken.)
2 A 13% reduction in the number of trips undertaken by car drivers. The average length of a car trip however is unchanged between 2002 and 2019, at miles per trips saw a slight fall from 2018 to 2019 to 250 trips per person per year, however this is an increase compared to the lowest levels of walking recently recorded in 2014. In the last 5 years, people in England made 14% more walking trips, and spent 12% longer walking, per LQ WKH OLJKW RI &29,' The data for this study was collected between January 2019 and December 2019. Data collection was therefore completed before the global outbreak of COVID-19 in March 2020.
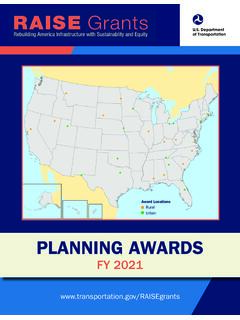
3 Travel trends will have been affected by the restrictions of early 2020, so care must be taken in comparing this release with current Travel behaviours. Statistics on transport use during the Coronavirus pandemic can be found on STATISTICIANS: Andrew KellyMEDIA ENQUIRIES: Media: 020 7944 3066 Public: 020 7944 3077 7 UDYHO 6 XUYH\ (QJODQG 0 DLQ 5 HVXOWV7 ULSV [NTS0101]Average trips per person per year'LVWDQFH [NTS0101]Average distance travelled per year7 LPH [NTS0101]Average time travelled per year+RZ ZH WUDYHOOHG [NTS0303]Modal shareTripsDistance:K\ ZH WUDYHOOHG [NTS0409]The most common trip purposes were.)
4 Leisure Shopping People made 953 trips on average in 2019, or 18 trips a week. This was a 3% decrease on the level in 2018. People travelled an average of 6,500 miles in 2019, unchanged from , the trip rate in 2019 was 11% lower than the 2002 JXUH RI WKH DYHUDJH RI PLOHV WUDYHOOHG LQ was 10% lower than the 7,193 recorded in average, people spent just over an hour a day travelling in 2019, including 35 minutes by car (as a driver or passenger), 11 minutes walking, 13 minutes on public transport and 2 minutes on other private transport most common trip purpose in 2019 was for leisure (26%), followed by shopping trips (19%) and commuting (15%).
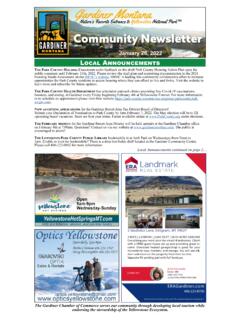
5 These proportions are broadly unchanged since 2002, but the total amount of trips and total distance travelled has decreased since 2002, and 2018. 8 QGHUVWDQGLQJ UHDVRQV IRU WKHVH WUHQGV LV GLI FXOW The averages presented here mask different trends for different types of people, modes and types of trip . Some of the many factors might include changing demographic patterns, changing patterns of trips, and the impact of new WHFKQRORJLHV LQ XHQFLQJ WKH GHPDQG IRU WUDYHO IRU H[DPSOH the increase in online social networking, the capability for home working and online Travel Survey 2019 - Page 2 National Travel Survey 2019 - Page 3&\FOLQJ [NTS0303, NTS0608]Average cycling trips and distance per year&DU RZQHUVKLS [NTS0205] of households owned at least one car/LFHQFH KROGLQJ [NTS0201] of residents(17+)]
6 Held a driving licence PLOOLRQ licence holders of males of femalesPeople with access to a bicycle, by age (2017-2019)*HQGHU [NTS0601, NTS0605]Average trips and distance per person per year, by the gender of the respondent7 ULSV SHU \HDU'LVWDQFH PLOHV Commuting trips per person per year, by age and gender, 2019In 2019 men made 8% fewer trips than women, but travelled IXUWKHU 7 KLV SDUWO\ UH HFWV GLIIHUHQFHV LQ WKH W\SH RI trips made. Women make more trips for shopping and escort education, which tend to be relatively short, whereas men make more commuting trips, which tend to be 2019, 75% of English residents aged 17 and over held a driving licence.
7 Around 80% of men in this group hold a licence, D JXUH WKDW LV EURDGO\ XQFKDQJHG VLQFH $URXQG RI ZRPHQ LQ WKLV JURXS KROG D GULYLQJ OLFHQFH KRZHYHU WKLV JXUH has grown by 15% since 2002. Between 2002 and 2019 the number of licence holders increased by over two and half times, to million regards to the proportion of men and women who live in households without access to a car, the proportion of men in these households in 2019 was 17%, an increase of half a percentage point since 2002. When considering women, 20% live in households without access to a car, a decrease of percentage points over the same at households in England, 76% own at least one car, an LQFUHDVH RI SHUFHQWDJH SRLQWV VLQFH 7 KLV JXUH GHSHQGV heavily on the household income: 55% of households in the bottom 20% of household income during 2019 own at least one car (up 5 percentage points since 2002), compared to 86% of households in the top 20% of household income during 2019 (up 2 percentage points since 2002).
8 1 DWLRQDO 7 UDYHO 6 XUYH\ (QJODQG 0 DLQ 5 HVXOWVI ntroduction to the 2019 NTSThe 2019 National Travel Survey (NTS) is the latest in a series of household surveys designed to provide a consistent source of data on personal Travel behaviour across National Travel Survey is a household Survey of personal Travel by residents of England travelling within Great Britain, from data collected via interviews and a seven-day Travel NTS is part of a continuous Survey that began in 1988, following ad-hoc surveys from the 1960s, which enables analysis of patterns and key uses of the data include describing patterns, for example how different groups of people Travel .)
9 Monitoring trends in Travel , including sustainable modes; assessing the potential equality impacts of different groups; and contributing to the evaluation of always welcome feedback to help ensure that the Survey meets the needs of users, and any feedback provided will help inform the future design and development of the statistics were designated as National Statistics in July 2011. The continued designation was confirmed in September youThe 2019 Survey fieldwork, data input, coding and some analysis was carried out by the National Centre for Social Research.
10 Special thanks are due to the project team, the coders and to all the interviewers at help of the members of the public who gave their time to respond is gratefully micro-level NTS data for analysisIn addition to the published statistics described in this document together with accompanying statistical tables, the underlying dataset and guidance in analysing it can be accessed from the UK Data Service or the Office for National Statistics Secure Research Service for users who wish to explore the data for Travel is included in the NTS?The NTS only includes personal Travel within Great Britain, by residents of private households in England, along the public highway, by rail or by air.