Transcription of 2019 PHYSICAL ACTIVITY COUNCIL S OVERVIEW REPORT ON …
1 2018 PARTICIPATIONREPORTThePhysical ACTIVITY COUNCIL s annual study tracking sports, fitness, and recreation participation in the USTABLEOFCONTENTS2018 PHYSICAL ACTIVITY COUNCIL participation ReportYour guide through the 2018 participation ReportMethodology3 PHYSICAL ACTIVITY COUNCIL (PAC)4 Overview5 Overall participation Rate in the US6-9 ACTIVITY Level Trends62011 2016 participation Trends7 participation by Generation8-9 Overall Inactivity Levels in the US10-122011 2016 Inactivity Trends10 Inactivity by Age11 Inactivity by Income12 Aspirational Participants and PE Participation13-15 Non- participation Interest13-14 The PE Pathway15 Appendix 1: Sports Categorized16 Appendix 2: ACTIVITY Levels172 METHODOLOGY2018 PHYSICAL ACTIVITY COUNCIL participation Report3 This OVERVIEW REPORT from the PHYSICAL ACTIVITY COUNCIL , (PAC), is produced by a partnership of eight of the major trade associations in US sports, fitness, and leisure industries.
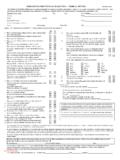
2 Each partner produces more detailed reports on their specific areas of interest, but this OVERVIEW REPORT summarizes topline data about levels of ACTIVITY in the US. The overall aim of this REPORT is to establish levels of ACTIVITY and identify key trends in sports, fitness, and recreation participation in the US. For more detailed results, please contact the specific industry partner on the following 2017, a total of 30,999 online interviews were carried out with a nationwide sample of individuals and households from the US Online Panel of over one million people operated by IPSOS. The total panel is maintained to be representative of the US population for people ages six and older.
3 Over sampling of ethnic groups took place to boost responses from typically under responding 2017 participation survey sample size of 30,999 completed interviews provides a high degree of statistical accuracy. All surveys are subject to some level of standard error -that is, the degree to which the results might differ from those obtained by a complete census of every person in the US. A sport with a participation rate of five percent has a confidence interval of plus or minus percentage points a the 95 percent confidence weighting technique was used to balance the data to reflect the total US population ages six and above. The following variables were used: gender, age, income, ethnicity, household size, region, population density, and panel join date.
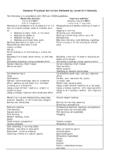
4 The total population figure used was 298,325,103 people ages six and older. Inactivity is defined to include those participants who reported no PHYSICAL ACTIVITY in 2017 and an additional 17 sports/fitness activities that require minimal to no PHYSICAL reported for winter sports are based on seasons: 2012 year is 2011/2012 season, 2013 year is 2012/2013 season, 2014 year is 2013/2014 season, 2015 year is 2014/2015 season, 2016 year is 2015/2016 season, and 2016/2017 the 2018 REPORT research was conductedPHYSICALACTIVITYCOUNCIL(PAC)201 8 PHYSICAL ACTIVITY COUNCIL participation Report4 More about the PAC and further researchEach year, the PHYSICAL ACTIVITY COUNCIL (PAC) conducts the largest single-source research study of sports, recreation and leisure ACTIVITY participation in the nation.
5 The PAC is made up of eight of the leading sports and manufacturer associations that are dedicated to growing participation in their respective sports and leading trade and industry organizations are dedicated to providing the most comprehensive, accurate, and actionable database of sports participation data. The respondents come from a panel of over one million Americans and are managed by IPSOS. The study looks at 123 different sports and activities in a variety of sub categories including, but not limited to: team and individual sports, outdoor sports and activities like camping, hunting, and fishing; fitness and exercise, action sports, golf, tennis, and much data, dating back as far as 2007, is representative of the US population ages six and older.
6 Universally accepted research practices are used to ensure data is obtained from traditionally under responding segments of the population. Please contact any of the individual members of the PAC or Sports Marketing Surveys to learn more about the study and other available you have specific questions regarding the methodology, please contact Sports Marketing Surveys USA at (561) PHYSICAL ACTIVITY COUNCIL is made up of the following industry leading organizations: CLUB/INSTITUTIONALFITNESS: International Health, Racquet, and SportsclubAssociation (IHRSA) : (617) 951-0055 GOLF: National Golf Foundation (NGF) : (561) 744-6006 OUTDOORACTIVITIES/SPORTS: Outdoor Foundation (OF) : (202) 271-3252 SNOWSPORTS: SnowsportsIndustries of America (SIA).
7 (435) 657-5140 TEAMSPORTS/INDIVIDUALSPORTS/GENERALFITNE SS/WATERSPORTS:Sports & Fitness Industry Association (SFIA) : (301) 495-6321 FOOTBALL: USA Football : (317) 489-4417 TENNIS: Tennis Industry Association (TIA) and United States Tennis Association (USTA) : (843) 686-3036 OVERVIEW2018 PHYSICAL ACTIVITY COUNCIL participation Report5An OVERVIEW of the research and insights into the numbersThe PHYSICAL ACTIVITY COUNCIL s annual study continued to track participation in 118 sports and fitness activities. This REPORT gives a broad OVERVIEW of the study. For more details on specific sports, please contact the specific industry looking at how ACTIVITY played out during 2017, it looks very similar to 2016.
8 While 72% of the population ages six and over were active, the level of ACTIVITY continues to trend towards a lesser frequency. Of the million Americans who were active, well over half, million, participated at the maximum three times a week. Around 62 million participated in low calorie burning activities (see Appendix 2).The largest focus of activities continues to be toward fitness sports. Winter sports gained the most of all categories, increasing 2% over the last year. Although the rate of inactivity has remained flat for the last 5 years, the number inactive rose due to population increase. million people were inactive in 2017, that was million more people when compared to 2012.
9 While the Gen Z generation are moving towards a slightly more active lifestyle, those 65 and over are less active than they were in interest in activities has started moving toward outdoor recreation. The top aspirational ACTIVITY for all age segments was outside, ranging from camping to biking to birdwatching. While camping appears to be in the top three in most segments, solo adventures are becoming a lost art and most people who aspired to camp will do so if they have someone to do it with. People want to experience the outdoors, fitness classes, teams sports, etc. with a PHYSICAL ACTIVITY COUNCIL participation Report6A breakdown of ACTIVITY levels over timeInactive to Healthy Active Across 5 yearsUS Population, Ages 6+ of Individuals Ages 6+Active to a Healthy Level and Beyond (151+ times) High Calorie Burning ActivitiesActive (51~150 times) High Calorie Burning ActivitiesCasual (1~50 times) High Calorie Burning ActivitiesLow to Med Calorie Burning ActivitesNone (Inactive) ACTIVITY and inactivity flatten out across the board, in 2017.
10 Those who were fitness junkies remained fitness junkies, and those who rather take the path of less resistance, remained on that path. So what did change? There are to casual participants than core participants compared to 5 years ago. Looking at the low to medium and the casual categories, these participants grew , on average, since 2012; while the more active participant dropped 2% on -2017 PARTICIPATIONTRENDS2018 PHYSICAL ACTIVITY COUNCIL participation Report7A look at PHYSICAL ACTIVITY participation by yearTotal participation Rate by ACTIVITY CategoryUS Population, Ages 6+ sports/activities continues to have the highest participation rates; having 64% of the US population ages 6 and over engaging in activities like running/jogging, high intensity/impact training, row machines, and swimming.