Transcription of 2020 Child Welfare Data Book - oregon.gov
1 2020. Child Welfare Data Book Prepared by Office of Reporting, Research, Analytics, and Implementation oregon Department of Human Services September 2021. Data is correct as of the date of publication Table of Contents Fast Facts for FFY 2020 page 1. Child Protective Services page 4. In-Home Family Services page 11. Foster Care page 14. Adoption & Guardianship Program page 21. Appendix: County Data page 26. Fast Facts for FFY 2020. Child Protective Services The oregon Child Abuse Hotline (ORCAH)'s total contacts (calls and cross-reported police reports) answered during Federal Fiscal Year (FFY) 2020 (October 2019-September 2020), was 150,815. Of those ORCAH contacts, a total of 78,632 screening reports were A total of 42,126 received reports were assigned for CPS A total of 37,559. CPS assessments were completed, which includes reports that were assigned in the previous Of all completed CPS assessments, 7,772 were founded for abuse and involved 11,642.
2 Victims. Of those victims, 2,304 ( ) were removed from their homes. Of all victims, percent were 5 years old and younger. Of all types of abuse incidences, the threat of harm was the most frequently identified type of abuse ( percent), followed by neglect ( percent). At 41 percent, parent/caregiver alcohol or drug abuse issues represented the most common family stress factor when Child abuse was present. The next most common stressors were domestic violence ( percent) and parent/caregiver involvement with law enforcement agencies ( percent). In-Home Family Services During FFY 2020, a total of 6,963 children received case management and safety services while being served in their homes. Of the total served in-home, 36 percent received additional services. 1 This number reflects all potential reports of Child abuse that are screened by ODHS ( Child Welfare and the Office of Training, Investigation and Safety) and includes a variety of notifications.
3 2 All references to assigned CPS assessments also include Child abuse reports assigned by Office of Training, Investigation and Safety (OTIS) for investigation. 3 Reports assigned for CPS assessment can be combined with a currently open CPS assessment, changing the count of CPS. assessments. Further, when this combination happens, it can impact the time period in which the now-linked report shows up in. 1. Foster Care Total Served A total of 9,838 children spent at least one day in some kind of foster care such as family foster care, professional treatment programs, psychiatric residential treatment, pre- adoptive placements, developmental disability placements, and independent living. Of the total children served in foster care, were White, were Hispanic, were Black or African American, were American Indian or Alaska Native, did not have race recorded, and were Asian or Paci c A total of 1,250 youth received independent living program services.
4 Of all children leaving foster care, were reunited with their families. Average Daily Population An average of 6,790 children were in foster care daily. Of these: o An average of 4,819 children were in family foster care. Of those, percent (about 2,278 children) were placed with relatives. o An average of 700 children were on trial home visit. o An average of 171 children and young adults were served in treatment foster care through Child Welfare Behavioral Rehabilitation Services programs or oregon Health Authority psychiatric treatment settings. o The remaining 1,100 children were in other types of foster care placements such as developmental disability placements, pre-adoptive placements, and independent living. Point in Time Of the 6,351 children in care on September 30, 2020, percent (3,733) had two or fewer placements. Adoption & Guardianship Program A total of 868 children had adoptions nalized. Of these, were White, were Hispanic, were Black or African American, were American Indian or Alaska Native, were Asian or Pacific Islander and had no race recorded.
5 Of those adopted, 425 had siblings and of those, 387 ( ) were adopted by the same family. 4 Race categories are defined in compliance with REAL-D (OAR 943-070-0010) and Census Bureau standards and are gathered through self-identification. Children may have multiple races. The primary race is the first one identified. If a Child self-identifies as Hispanic in addition to other races, their race category will be Hispanic (any race). 2. A total of 375 children exited foster care to guardianship. Of these children, were White, were Hispanic, were American Indian or Alaska Native, were Black or African American, were Asian or Pacific Islander, and had no race recorded. 3. Child Protective Services Screening Reports and Reporters of Suspected Child Abuse oregon Child Welfare consolidated fifteen regional hotlines into one operation over a period of eight months. The centralized hotline, known as the oregon Child Abuse Hotline (ORCAH), began serving the entire state on April 4, 2019.
6 Prior to that, call volume data was not captured consistently throughout the state. ORCAH serves as one of the first points of contact for children in oregon at risk for or experiencing abuse and neglect. The 24-hour hotline receives, and screens reports of Child abuse and neglect statewide, and provides guidance and subject matter expertise to callers and partners to ensure Child safety. The hotline also assigns reports for Child Protective Services (CPS) assessments when allegations of abuse meet criteria for assignment and to ensure Child safety. Additionally, the hotline serves Oregonians through cross-reporting to local law enforcement, completes required notifications with multiple community partners and refers to services when appropriate. ORCAH receives calls and cross-reported police reports, collectively referred to as contacts.. A portion of these contacts resulted in a documented screening report or a case note on an open case. The remaining contacts are generally callers seeking information or providing information that is not related to reports of alleged abuse or open cases.
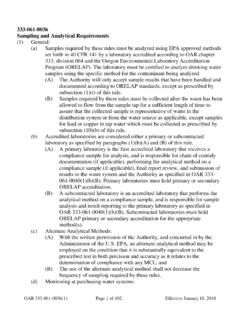
7 ORCAH's total contacts answered during FFY 2020 was 150,815. Of those contacts received, 78,632 resulted in a screening report being documented, a decrease of percent from the prior year. During FFY 2020: Public and private officials required by law to report suspected Child abuse made up percent of the screening reports received by Child Welfare . Of all reports, percent came from schools and law enforcement agencies . Source of Suspected Child Abuse Reports School Medical Police Other mandated Parent/Self Other non mandated 4. Response Time for CPS Assessments The response time for a CPS worker to make contact is determined by the information collected from the reporter, a review of Child Welfare history and information gathered from relevant search engines. Prior to April 8, 2019, there were two types of response times: within 24 hours and within 5 days. oregon Administrative Rules were updated and went into effect on April 8 resulting in three types of timelines: Within 24 hours, within 72.
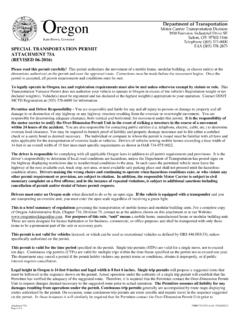
8 Hours, and within 10 days (when there is no danger posed to the Child ). The Within 5. Days option was discontinued at this time. Over 61 percent ( ) were assigned a response time of within 24 hours. Reports Assigned for CPS Assessments Of the 78,632 screening reports received, 42,126 were assigned for CPS assessment. Total Suspected Child Abuse Reports 100,000. 89,451. 90,000 84,233. 80,665 78,632. 80,000 76,668. 74,342. 69,972. 70,000 67,633 67,863. 64,305. 60,000. 50,000. 40,000. 30,000. 20,000. 10,000. - Year During the year, 37,559 CPS assessments were completed. Of this total, 7,772. ( percent) resulted in a founded disposition. The 7,772 CPS assessments with founded dispositions represent percent of the total abuse reports. Once there is a founded disposition, the children for whom there is reasonable cause to believe they were abused are considered victims of Child abuse. Victims of Abuse During FFY 2020, there were 11,642 unduplicated Child abuse victims.
9 Most Child victims remained in their own homes ( percent), while percent of Child victims were 5. removed from their homes. This is an increase of over FFY 2019 for those remaining in their homes. Of the total victims, 13 percent remained home with an in-home safety plan and percent remained in their homes, but Child Welfare determined that it was not necessary to open a case to keep the Child (ren) safe. The following data show the key demographics of children who were victims of Child abuse during FFY 2020. FFY 2020 Victims by Age and Gender Percent of Age Boys Girls Total Total <1 662 599 1,261 1 413 332 745 2 407 344 751 3 403 350 753 4 417 349 766 5 363 335 698 6 337 328 665 7 327 330 657 8 342 298 640 9 312 252 564 10 315 311 626 11 262 304 566 12 269 332 601 13 236 337 573 14 199 327 526 15 160 308 468 16 160 293 453 17 125 204 329 Total 5,709 5,933 11,642 During FFY 2020, a total of percent of victims were of more than one race. However, the following data for oregon displays the Child 's first recorded race/ethnicity.
10 It also displays the disproportionality index. Victims of Child Abuse/Neglect FFY 2018 - FFY 2020. Race/Ethnicity FFY 2018 FFY 2019 FFY 2020. Black or African American Asian/Pac Islander White Hispanic (any race) American Indian or Alaska Native Unable to Determine 6. Disproportionality Index (DI) and Representation by Race for Victims of Child Abuse for FFY 2020 Compared to oregon 's Child Population # of % of # of % of Victims oregon 's oregon 's Victims of of Child DI**. Race Children* Children Child Abuse abuse 1=Proportionate Black or African American 32,295 534 Asian/Pac Islander 48,228 222 White 578,872 6,809 Hispanic (any race) 193,482 1,506 American Indian or Alaskan Native 13,685 423 Unable to Determine n/a 2,148 n/a Statewide Total 866,562 11,642 *Population data is always a year behind. Population data is from Puzzanchera, C., Sladky, A. and Kang, W. (2020). "Easy Access to Juvenile Populations: 1990-2019." Online. Available: **Disproportionality Index (DI) is calculated by taking the percent by race of victims of Child abuse and dividing it by the percent by race in oregon 's Child population.