Transcription of 2020 FULL YEAR RESULTS - assets.unilever.com
1 Underlying sales g rowt h (US G ), underlying v olum e gr owt h (UVG), u nder lyi ng p ric e g rowt h (UP G ) , u nder lyi ng op erat in g pr o fi t (UO P ) , un derl yi ng op erat ing mar gin (UO M ) , u nder lyi ng e arni ngs per shar e ( unde rly ing EP S ), const ant underlying E PS , under ly ing e ffe ctive tax r ate, f ree c a sh f low (F C F), ne t debt, r et urn on i nv e s te d capital (R O I C ) an d un derl yi ng ear nin gs bef ore inter est, taxation, depr eciation and a mortisation ( UEB I TD A ) ar e no n-G A AP m eas ure s (see pages 7 to 11) 2020 FULL YEAR RESULTS Performance highlights (unaudited) Underlying performance GAAP meas ures vs 2019 vs 2019 Full Year Underlying sales growth (USG) Turnover ( )% Underlying operating profit ( )% Operating profit ( )% Underlying operating margin (60)bps Operating margin (40)bps Underlying earnings per share ( )% Diluted earnings per share ( )% Free cash flow Net profit Fourth Quarter USG Turnover ( )% Quarterly dividend payable in March 2021 per share* * See note 10 for more i nformati on on di v i dends.
2 Full year highlights Underlying sales growth of , with volume and price Tur no v er de crea sed 2 .4%, primarily driven by a negative impact of from currency r el ated ite ms Underlying operating profit decreased , but increased by at constant exchange rates Underlying earnings per share decreased , but increased 4 . 1% at constant exchange rates Diluted earnings per share of Free cash flow up billion to billion, r eflecting our objective to protect cash Dividend maintained through the year and increased in the fourth quarter by 4% to 0. 426 8 per share Unified the group legal structure under a single parent company Alan Jope: Chief Executive Officer s tatement In a volatile and unpredictable year, we have demonstrated Unilever s resilience and agility through the Covid-19 pandemic. I would like to thank the Unilever team, whose dedication and hard work has delivered a strong set of RESULTS under the most difficult of circumstances.
3 Early in the year, we refocused the business on competitive growth, and the delivery of profit and cash as the best way to maximise value. We have delivered a step change in operational excellence through our focus on the fundamentals of growth. As a result, we are winning market share in over 60% of our business in the last quarter, on the basis of measurable markets. The business also generated underlying operating profit of billion and free cash flow of billion, an increase of billion. We progressed our strategic agenda, building on our existing sustainability commitments with ambitious new targets and actions, most recently with our plans to help build a more equitable and inclusive society. We completed the unification of our legal structure under a single parent company and we continue to work on separating out the tea business as we evolve our portfolio. Today we are setting out our plans to drive long term growth through the strategic choices we are making and outlining our multi-year financial framework.
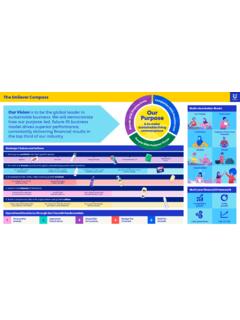
4 While volatility and unpredictability will continue throughout 2021, we begin the year in good shape and are confident in our ability to adapt to a rapidly changing environment. 4 February 2021 US G, UVG, UPG, UOP, UOM, underlying EPS, const ant underlying EPS, underlying effec t ive tax rat e, FCF, net debt , ROIC and UE BITDA are non-GAAP measures (se e p ages 7 to 11) 2 FUTUR E STR ATEGY AND MULTI-YEAR financial FRAMEWORK As one of the world s largest consumer goods businesses, Unilever serves consumers through our purposeful brands. Our vision is to be the global leader in sustainable business. We will demonstrate how our purpose-led future fit business model drives superior performance, consistently delivering financial RESULTS in the top third of our industry. Our differentiating s trengths Unilever s success over the last 130 years and its future success are shaped by the strengths that give us competitive advantage.
5 We have a powerful portfolio of leading category and brand positions, with billion people using our products every day. We have a strong presence in the markets that will drive global growth in the years ahead and o ur global leadership in sustainability and commitment to sustainable business is widely recognised. Our strategic choices We have made five strategic choices that we believe will support our future growth and help us realise the potential of the business. 1. Develop our portfolio into high growth spaces, positioning Unilever in the categories that will drive future growth. This will be our guiding strategy behind the choices we make for organic investment and for our acquisitions and disposals. 2. Win with our brands as a force for good, powered by purpose and innovation. Purpose-led brands have been at the heart of Unilever throughout our history and purpose continues to dominate our thinking and our portfolio today as it becomes even more relevant to consumers.
6 We will underpin our focus on purpose with differentiated science and technology that ensures our brands and products have superior quality and efficacy. 3. Accelerate in the USA, I ndia and China and le v erage o ur emerging marke ts strength. Unilever has strong brand and category leadership positions in the USA, India and China, with around 35% of our turnover coming from those three countries alone, and we believe we can bring sharper focus in those geographies and build even stronger positions. There is also significant opportunity beyond these markets and we will continue to build on our strong operating businesses in the world s fastest growing economies. 4. Lead in the channels of the future. Position our business for success in the channels of the future, focusing particularly on e-commerce and digitising the distributed trade, underpinned by advanced shopper insight as the consumer and customer landscape continues to evolve.
7 5. Build a purpose-led, future-fit organisation and growth culture. Driving growth through capacity, capability and culture, while continuing to generate fuel for growth. Multi-year financial framework We will deliver long term value creation by continuing to evolve our portfolio and driving earnings growth, a strong cash flow and a growing dividend. Underlying sales growth ahead of our markets, delivering USG in the range of 3% to 5% Profit growth ahead of sales growth, on a comparable basis Sustained strong cash flow over the long term Savings of 2 billion per annum from our well-established Fuel for Growth savings programmes Restructuring investment of around 1 billion for 2021 and 2022; lower thereafter ROIC in the mid-to-high teens Net Debt to Underlying EBITDA at around 2x US G, UVG, UPG, UOP, UOM, underlying EPS, const ant underlying EPS, underlying effec t ive tax rat e, FCF, net debt , ROIC and UE BITDA are non-GAAP measures (se e p ages 7 to 11) 3 FULL YEAR OPERATIONAL REVIEW: DIVISIONS Fourth Quarter 2020 Full Year 2020 (unaudited) Turnover USG UVG UPG Turnover USG UVG UPG Change in underlying operating margin bn % % % bn % % % bps Unilever (60) Beauty & Personal Care - (100) Home Care ( ) ( ) (30) Foods & Refreshment (50) Our markets: The operating environment in our markets has been volatile since the Covid-19 pandemic began in ea r ly 2020.
8 In the fourth quarter, we continued to see changes in consumer behaviour and channel dynamics. Strict lock-downs in China and India led to market declines in the first and second quarters respectively, with both markets subsequently returning to growth during the year. China has normalised in many categories, while economic activity in India picked up particularly in the final quarter. In North America and Europe, elevated demand for food consumed at home has continued to drive market growth, whilst consumer usage of most beauty and personal care categories remains subdued. In Latin America markets were broadly flat for the year and several South East Asian markets contracted. Unilever overall performance: We focused on driving competitive growth through execution against our five growth fundamentals, responding with agility to changing dynamics driven by the pandemic, and delivered a step up in competitive performance.
9 For the full year we grew underlying sales by , with volumes growing and from price. In the fourth quarter underlying sales growth was , with volumes of and from price. Growth was driven by hand and home hygiene products, laundry and in-home food and refreshments. Food solutions and out of home ice cream sales declined, impacted by channel closures. As people stayed at home and had fewer opportunities to socialise, they spent less time on personal grooming which impacted sales in much of the Beauty and Personal Care business, except for hygiene products where demand was high. Category demand patterns varied throughout the year and by market, driven by the differing status of lock-down restrictions. E-commerce grew by 61%, as we captured demand in online channels, and is now 9% of Unilever. Emerging markets grew as China and India returned to growth, after strict lock-downs in the first half of the year.
10 China returned to growth in the second quarter as restrictions were eased, delivering high single digit growth in the second half. Latin America grew mid-single digit and Indonesia grew slightly, though declined in the final quarter. Developed markets grew , led by strength in North American in-home foods. Europe declined for the full year, but grew in the final quarter. Turnover decreased , including a positive impact of from acquisitions net of disposals and a negative impact of from currency movements. Underlying operating profit was billion, a decrease of including a negative impact from currency of Underlying operating margin decreased by 60bps. Gross margin reduced by 50bps, including a negative impact of 90bps from additional costs needed to adapt and run our supply chain and adverse mix from Covid-19. While brand and marketing investment was conserved in the first half during the early lock-down periods, we invested strongly behind our brands in the second half and, for the full year, brand and marketing investment was up 160 million at constant exchange rates.


