Transcription of 2021 Federal Poverty Guidelines Chart (Effective Jan. 13 ...
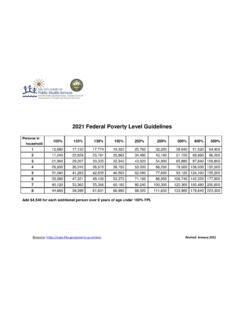
1 2021 federal poverty guidelines Chart (Effective Jan. 13, 2021) We have included multiple percentages in the Federal Poverty Level Chart below, as there are several programs, including Medicaid, that use a percentage of the FPL as the income criteria for program participation. 48 Contiguous States # of Persons in Household 2021 Federal Poverty Level for the 48 Contiguous States (Annual Income) 100% 133% 138% 150% 200% 300% 400% 1 $12,880 $17,130 $17,774 $19,320 $25,760 $38,640 $51,520 2 $17,420 $23,169 $24,040 $26,130 $34,840 $52,260 $69,680 3 $21,960 $29,207 $30,305 $32,940 $43,920 $65,880 $87,840 4 $26,500 $35,245 $36,570 $39,750 $53,000 $79,500 $106,000 5 $31,040 $41,283 $42,835 $46,560 $62,080 $93,120 $124,160 6 $35,580 $47,321 $49,100 $53,370 $71,160 $106,740 $142,320 7 $40,120 $53,360 $55,366 $60,180 $80,240 $120,360 $160,480 8 $44,660 $59,398 $61,631 $66,990 $89,320 $133,980 $178.
2 640 Add $4,540 for each person in household over 8 persons


![2021/2022 FEDERAL HHS POVERTY GUIDELINES [48 States]](/cache/preview/3/c/1/5/d/9/2/a/thumb-3c15d92a63935df5c8a3dada647c3a13.jpg)