Transcription of 2022 Annual Energy Paper
1 EYE ON THE MARKET | 12TH EDITION. 2022 Annual Energy Paper The Elephants in the Room. We start with a summary of the Energy landscape, including the Energy crisis in Europe, the recovery in the oil & gas sector and a warning label on industrial electrification and carbon sequestration forecasts. We continue with three topics on electrification, which is the foundation of many deep decarbonization plans: electric vehicle adoption by gasoline super-users, the transmission quagmire and bans on combustion of fossil fuels for heating in favor of electric heat pumps. We then conduct a detailed review of the hydrogen economy, whose liftoff is still many years away. We conclude with deep decarbonization plans for China, whose carbon intensity and emissions levels are the highest in the world.
2 By Michael Cembalest Chairman of Market and Investment Strategy for Morgan Asset & Wealth Management MARY CALLAHAN ERDOES. Chief Executive Officer Morgan Asset & Wealth Management My investment partner Michael Cembalest has released his 12th Annual Energy Paper . It examines the current Energy landscape and considers the challenges posed by the transition to a deeply decarbonized world at a time of both worsening climate signals and the increasing need for Energy independence. Michael's approach, as always, is focused on the details: the physical, chemical and geological factors that affect how Energy is derived and how we use and store it, and the human behaviors that affect Energy consumption and distribution. Michael's direct and forensic approach may strike some as signifying acceptance of the status quo.
3 On the contrary: To get where we want to go, we must distinguish between promising Energy innovations and expensive, unviable or unscalable distractions. We also must diagnose the roadblocks that we as citizens are putting in the way. This year's Paper , titled The Elephants in the Room, is designed to do exactly that: provide a detailed roadmap of the most important challenges ahead. We have much to lose by ignoring the realities of the world we live in, and much to gain by addressing them head on. Helping you position your portfolios for the future is our top priority, as always. We hope you find this Paper insightful, and we look forward to continuing our dialogue with you. Michael Cembalest Chairman of Market and Investment Strategy JP Morgan Asset Management 2022 Eye on the Market Energy Paper The events in Europe underscore the three unifying principles of our Annual Energy Paper since its inception 12 years ago.
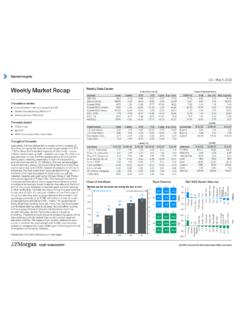
4 Energy transitions differ sharply from transitions in technology, healthcare and other sectors decarbonization of electricity is underway but decarbonization of industrial production, transport and heating lag much further behind countries that reduce production of fossil fuels under the assumption that renewables can quickly replace them face substantial economic and geopolitical risks The bottom chart shows performance of fossil fuel companies and their reportedly stranded assets vs renewable Energy companies. To quote Mark Twain: Reports of my death are greatly exaggerated . We review many of the reasons why in this year's Paper . My recommendation as you think about Energy issues: ignore all the hype, hyperbole and hockey stick forecasts and focus on the actual trends in the Energy transition.
5 Speed of disruption: some of these things are not like the others Percent 90% Percent of US population owning a smartphone 80%. NYC rideshare percent of dispatched trips 70%. Rural home broadband adoption Digital share of ad sales 60% Developing world internet access 50%. 40% Percent of adults using Instagram 30%. E-commerce share of clothing sales 20%. 10% Wind and solar share of global primary Energy consumption 0% EV share of global vehicles owned 2000 2003 2006 2009 2012 2015 2018 2021. Source: GroupM, Census, BP, IEA, FHV, Pew Research, NYC Taxi & Limousine Commission, JPMAM. 2021. Reports of my death are greatly exaggerated Rolling 12 mo. outperformance of fossil fuels vs renewable Energy , %. 100%. 50%. 0%. -50% Renewable composite: NASDAQ Clean Edge Index -100% WilderHill Clean Energy Index FTSE Environmental Opportunities Index S&P Global Clean Energy Index -150%.
6 MAC Global Solar Energy Index Fossil fuels: MSCI Global Energy Composite -200%. 2014 2015 2016 2017 2018 2019 2020 2021 2022. Source: Bloomberg, MSCI, JPMAM. April 29, 2022. 1. Executive Summary The fossil fuel share of global primary energy1 is declining at a slightly more rapid pace now, mostly a result of large investments in wind and solar power used for electricity generation. The market price to procure wind and solar power plummeted over the last decade, a consequence of scale and productivity gains2. Even so, fossil fuel reliance across the developed and developing world is still high (70% even in Europe) and the International Energy Agency projects that the world may still be 66% reliant on fossil fuels in 2050. What gives?
7 First, levelized costs comparing wind and solar power to fossil fuels are misleading barometers of the pace of change. Levelized cost estimates rarely include actual costs that high renewable grid penetration requires: (a) investment in transmission to create larger renewable coverage areas, (b) backup thermal power required for times when renewable generation is low, and (c) capital costs and maintenance of utility-scale battery storage. I am amazed at how much time is spent on this frankly questionable levelized cost statistic. Second, the benefits of grid decarbonization are limited by low electrification of industrial Energy use, heating and transportation. While electricity is used for some space/water heating, industrial motors and process heat, electricity is mostly used for space cooling, refrigeration, ventilation, computers and other electronic devices.
8 The world uses fossil fuels for ~83% of its Energy Average power purchase agreement by year of operation % of global primary Energy consumption from coal, oil and nat gas Real 2020 $ per megawatt hour 100% Pre-existing $220. hydropower Global solar photovoltaic Note: PPAs reflect the 95% $200 benefit of subsidies 90% $180 such as the US ITC. 85% $160. 80% Nuclear adoption Solar/wind $140 US solar 75% era begins IEA Stated era $120 photovoltaic 70% Policies Scenario $100. 65%. $80. 60%. IEA Announced $60 Global wind 55% US wind Pledges Scenario $40. 50%. 45% $20. 40% $0. '65 '70 '75 '80 '85 '90 '95 '00 '05 '10 '15 '20 '25 '30 '35 '40 '45 '50 2010 2012 2014 2016 2018 2020. Source: BP Statistical Review of World Energy , IEA, JPMAM.
9 2021. Source: Lawrence Berkeley National Laboratory, IRENA. 2021. Low levels of electrification in global industry and transport US electricity uses Quadrillion BTUs of final Energy consumed by sector Quadrillion BTUs 250. Direct renewables 5. 200 Direct fossil fuels 4. Electrification 150. 3. Space heating, water heating, motors and 100 process heat 2. 50 Space cooling, lighting, ventilation, 1 refrigeration, computers and other electronic equipment 0. Industrial Transport Residential Commercial 0. buildings buildings Residential Commercial Industrial Source: Energy Information Administration, JPMAM. 2021. Source: EIA, JPMAM. 2021. Transport too small to plot at quads 1. Primary Energy refers to thermal Energy contained in fossil and biomass fuels, and to thermal equivalents of primary electricity generated from nuclear, wind and solar power.
10 Converting primary electricity to primary Energy is generally done by dividing the former by an assumed Annual heat rate of fossil fuel plants (40% efficiency, equal to 9 MJ/kWh). Final Energy consumption is primary Energy less (a) Energy lost in oil refining and natural gas processing, (b) Energy lost in conversion of fossil fuels to electricity, (c) power plant consumption of electricity and (d) grid transmission losses. 2 In the US and Europe, wind and solar power purchase agreement levels are rising due to higher interest rates and inflation in industrial metals and other inputs. There are more PPA increases in the pipeline: wind turbine manufacturers just raised prices to the highest levels since 2015, and some are still unprofitable (GE, Siemens).
![MI-GTM 1Q17.pptx [Read-Only] - J.P. Morgan Asset …](/cache/preview/a/8/0/5/a/4/9/7/thumb-a805a4972c28a64389d8b5cdc3a7a25a.jpg)