Transcription of 231-2011: Repeated Measures Analysis of …
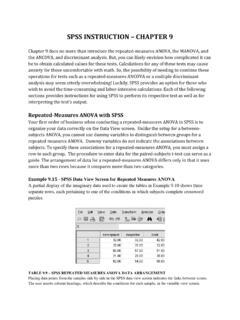
1 1 Paper 231-2011 Repeated Measures Analysis of correlated data with multiple Responses using SAS Anbuchelvi Jeyabalasingham, Kamarajar University, Vavuniya, Sri Lanka Anpalaki J Ragavan, Department of Mathematics and Statistics, University of Nevada, Reno, NV 89557, USA ABSTRACT When several measurements are taken on the same experimental unit, the measurements tend to be correlated with each other. When the measurements are responses to levels of an experimental factor of interest, such as time or treatment, the correlation can be taken into account by performing a Repeated Measures Analysis of variance. In addition, if there are multiple responses, the Analysis requires methods of multivariate Analysis combined with tools of Repeated Measures , which is a challenging task and requires careful attention to several details such as distributional variation among responses, correlations among responses, subject specific trend in the treatment variable.
2 In this research, Repeated Measures Analysis of correlated data with multiple response variables that are a mixture of continuous, count, and binomial is explored. The common problems that arise when analyzing such data are addressed in detail in SAS. data integrity testing, model selection and Analysis of the data are presented in a step-by-step protocol with the SAS codes used in each step and the output shown. The advantages and disadvantages of using the SAS procedures, GLM, MIXED, and GLIMMIX are compared. INTRODUCTION When several measurements are taken on the same experimental unit (ex: person, animal, machine), the measurements tend to be correlated with each other. When the measurements represent qualitatively different things, such as weight, length, and width, this correlation is best taken into account by use of multivariate methods, such as multivariate Analysis of variance.
3 When the measurements are responses to levels of an experimental factor of interest, such as time, treatment, or dose, the correlation can be taken into account by performing a Repeated Measures Analysis of variance. A popular Repeated - Measures design is the crossover study. A crossover study is a longitudinal study in which subjects receive a sequence of different treatments (or exposures). While crossover studies can be observational studies, many important crossover studies are controlled experiments. Repeated Measures allow conducting an experiment when few participants are available. The Repeated measure design reduces the variance of estimates of treatment-effects, allowing statistical inference to be made with fewer subjects.
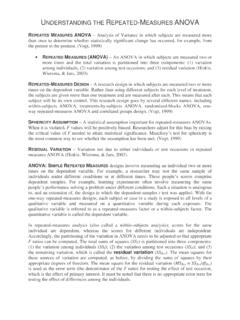
4 Repeated Measures allows to conduct experiment more efficiently: Repeated Measures designs allow many experiments to be completed more quickly, as only a few groups need to be trained to complete an entire experiment. For example, there are many experiments where each condition takes only a few minutes, whereas the training to complete the tasks take as much, if not more time. Repeated Measures designs allow researchers to monitor how the participants change over the passage of time, both in the case of long-term situations like longitudinal studies and in the much shorter-term case of practice effects. It is possible that clustered data arise when multiple observations are collected on the same subject or experimental unit at different points in time or space, which leads to a special class of Repeated Measures , longitudinal, and spatial data , where multiple observations refer to different attributes.
5 When there is clustered data structure, it is of interest to study the influence of clusters on the Analysis rather than the influence of individual observations. A cluster comprises the Repeated measurements for one or more subject. In this paper a Repeated Measures Analysis on a data set with multiple responses, which included continuous, count, and binomial response variables (weight (Y1), continuous response ), free food intake (Y2), binomial response , number of unplanned meals (Y3), count response ), taken on 101 subjects over a period of twenty four weeks at four weeks interval (4th , 8th , 12th and 24th week). The data indicated clustered observations and correlations among the response variables.
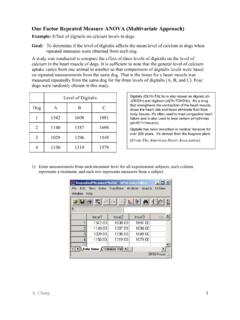
6 Each subject also received one of two treatments, the diet type (low carbohydrate (LC) or low fat (LF) diet). Three SAS procedures PROC MIXED, PROC GLIMMIX and PROC GLM were compared in performing the Analysis of the data . PostersSASG lobalForum2011 2 METHODS ANALYSING data USING THE GLM PROCEDURE One approach to analyze such data is to fit a triply multivariate Repeated Measures generalized linear model with PROC GLM with an IDENTITY statement along with the Repeated statement. This differs from previous releases of PROC GLM, in which a MANOVA statement is used to perform a Repeated Measures Analysis with multiple responses. Three responses, Y1, Y2, and Y3 are each measured four times for each subject (4th week, 8th week, 12th week and 24th week).
7 Each subject received one of two treatments (low carbohydrate diet or a low fat diet). In PROC GLM, a Repeated factor of type IDENTITY is used to identify the different responses and another Repeated factor to identify the different measurement times. The Repeated Measures Analysis includes multivariate tests for time and treatment main effects, as well as their interactions, across responses as produced by the following statements (SAS CODE 1). In the above statement response is 1 for all the Y1 measurements, 2 for all the Y2 measurements and 3 for the Y3 measurements, while the four levels of TIME identify the Week4 Week8, Week12 and Week24 measurements within each response . A table of multivariate tests for within-subject effects, response *Treatment tests for an overall treatment effect across the three responses, tables for response *Time and response *Treatment*Time test for time and the treatment-by-time interaction are output (see SAS output below, Table 1, Table 2, and Table 3).
8 Table 1 MANOVA Test Criteria and Exact F Statistics for the Hypothesis of no response Effect H = Type III SSCP Matrix for response E = Error SSCP Matrix S=1 M= N= Statistic Value F Value Num DF Den DF Pr > F Wilks' Lambda 3 53 <.0001 Pillai's Trace 3 53 <.0001 Hotelling-Lawley Trace 3 53 <.0001 Roy's Greatest Root 3 53 <.0001 The first table (Table 1) displayed shows that the response effect is significant. In addition, the response *Time interaction is significant, as shown in Table 2. However, the response *Treatment interaction was not significant. Other tables are not shown due to space restriction. There is also a significant between subject effect for the treatment (p= ) as shown in Table 3.
9 In previous releases (before the IDENTITY transformation was introduced), in order to perform a triply Repeated Measures Analysis , a MANOVA statement with a customized transformation matrix M had to be used. The MANOVA statement computed a univariate ANOVA for each transformed variable and provided a test for the overall main effect of time with the SUMMARY option (SAS CODE 2). The SUMMARY option in the MANOVA statement created an ANOVA table for each transformed variable as defined by the M matrix (differences of the 4th week, 8th week, 12th week, 24th week and so on). Results from SAS CODE 2 are not shown, but left for the reader to be obtained by running the SAS CODE given. SAS CODE 1 proc glm data =food; class Treatment; model Y1_4 Y1_8 Y1_12 Y1_24 Y2_4 Y2_8 Y2_12 Y2_24 Y3_4 Y3_8 Y3_12 Y3_24= Treatment / nouni; Repeated response 3 identity, Time 4; run; PostersSASG lobalForum2011 3 Table 2 MANOVA Test Criteria and Exact F Statistics for the Hypothesis of no response *Time Effect H = Type III SSCP Matrix for response *Time E = Error SSCP Matrix S=1 M= N= Statistic Value F Value Num DF Den DF Pr > F Wilks' Lambda 9 47 <.
10 0001 Pillai's Trace 9 47 <.0001 Hotelling-Lawley Trace 9 47 <.0001 Roy's Greatest Root 9 47 <.0001 Table 3 ANALYSING data USING THE MIXED PROCEDURE In Repeated Measures situations, the mixed model approach, which can be analyzed with PROC MIXED or PROC GLIMMIX, is more flexible and more widely applicable than either the univariate or multivariate approach discussed above. The mixed model approach with PROC MIXED also provides a larger class of covariance structures and a better mechanism for handling missing values (Wolfinger and Chang, 1995) than the traditional univariate or multivariate Analysis approach. PROC MIXED is a generalization of the GLM procedure and fits the wider class of mixed linear models, while PROC GLM fits standard linear models.