Transcription of 27 February 2014 Original: English E
1 ICC 112-4. 27 February 2014. Original: English E. International Coffee Council Coffee consumption in East and 112th Session Southeast Asia: 1990 2012. 3 7 March 2014. London, United Kingdom Background In accordance with Article 34 of the International Coffee Agreement 2007, the International Coffee Organization is required to provide Members with studies and reports on relevant aspects of the coffee sector. This document contains a report on coffee consumption in East and Southeast Asia since 1990, looking at the dynamics of regional and national markets and prospects for future growth. Action The Council is requested to take note of this document. COFFEE CONSUMPTION IN EAST AND SOUTHEAST ASIA: 1990 2012. INTRODUCTION. 1. The hot drinks market in Asia has traditionally been dominated by tea consumption, rather than coffee.
2 However, in recent years, the Asian coffee market has increasingly become the focus of the world coffee industry. Since 1990, Asia has experienced the most dynamic growth in coffee consumption in the world (see Figure 1), growing by an average rate of 4% per annum, increasing to since the year 2000. As such, the region is of increasing interest to the coffee sector, both for producers and consumers, and represents a significant potential market for the coffee industry. Figure 1: Growth in coffee consumption by region (1990 - 2012). 300. 250. Asia Index: 1990=100. 200. South America 150 Africa Central America 100. North America 50 Europe 0. 2. This study focuses specifically on the dynamics of coffee consumption in East and Southeast Asia since 1990, and expands on the study Coffee in China (ICC-111-8), published in August 2013.
3 It gives an overview of coffee demand growth in the region 1 as a whole, before giving a brief summary of developments in selected individual markets, specifically Japan, Indonesia, South Korea, the Philippines, Vietnam, Thailand, China (including Macao and Hong Kong), Taiwan, Malaysia, Laos and Myanmar. The remaining markets of Brunei, North Korea, Cambodia, Mongolia and Timor-Leste are discussed in less detail, as the overall volumes involved are still very low. Finally, due to the lack of consistent data, coffee consumption in Singapore is not included in this analysis, although external sources suggest there is a relatively strong coffee culture present. 1. This study refers to the geographical region of Eastern and Southeastern Asia, as defined by the United Nations Statistics Division, with the addition of Taiwan.
4 Furthermore, the term country' is used in a broad sense for what are officially classed as customs territories', but which may not be countries in the usual sense of the word. The denomination and classification used herein do not imply, on the part of the ICO, any judgement as to the legal or other status of any territory, or any endorsement or acceptance of any boundary. -2- 3. Out of the sixteen countries in East and Southeast Asia, only Indonesia, the Philippines, Thailand, Timor-Leste and Vietnam are currently Members of the ICO. As such, data availability for many of the remaining countries can be limited in some cases, with the result being that the accuracy of the information contained in this report may vary. Indonesia, Laos, the Philippines, Thailand, Timor-Leste and Vietnam are all coffee-exporting countries, while Brunei, Cambodia, China, Japan, North and South Korea, Malaysia, Mongolia, Myanmar, Singapore, and Taiwan are classed as coffee importers.
5 4. This study covers total consumption since 1990, including where possible data on per capita consumption, trade data and market composition. However, there are still several aspects missing from this analysis. Although total coffee consumption generally increases with income, it would be useful to observe more detailed trends, such as the relationship between consumption, gender and age, or the effect of an existing preference for tea consumption. Furthermore, it would be interesting to break down the national and regional markets further, to observe trends in fresh coffee compared to instant, the development of single-serve pods, or patterns of at-home compared to out-of-home consumption. More detailed data on such aspects are not currently publicly available, but would certainly merit further study.
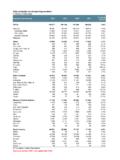
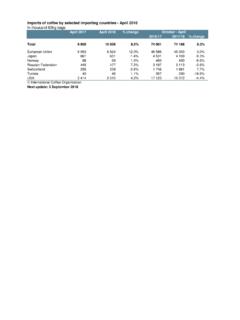
6 -3- Regional Summary 5. Coffee consumption in the region has been growing strongly over time, more than doubling from million 60kg bags in 1990 to million bags in 2012. This represents an average growth rate of per annum. Furthermore, the share of East and Southeast Asia in world coffee consumption has also been increasing, accounting for of the world total in 2012, up from in 1990 and in 2000 (see Figure 2). Figure 2: Coffee consumption in East and Southeast Asia and % share in world consumption (1990 2012). 25 000. 20 000. Thousand bags 15 000. 10 000. 5 000. 0. 1990 2000 2012. 6. Consumption growth in many Asian countries has been driven primarily by demand for Robusta coffee, which is used in soluble coffee and ready-to-drink products such as 3-in-1 mixes (coffee with whitener and sweetener) or 4-in-1 preparations (coffee with whitener, sugar and flavourings or dietary additions).
7 This is particularly true in several Southeastern markets such as Indonesia, the Philippines, Thailand and Malaysia, which tend to have large populations and a low but increasing per capita consumption. More developed markets tend to exhibit a higher percentage of Arabica consumption and specialty coffee industry, as can be seen in Japan, Taiwan and South Korea. -4- 7. Japan is by far the largest coffee market in the region, consuming million bags in 2012, and nearly twice the size of Indonesia. Relatively significant consumption can also be found in the Philippines, South Korea, Vietnam and Thailand, while China is also emerging as a major consumer. In terms of per capita consumption, the situation is slightly different. Japan is still one of the most significant markets, consuming per person, but behind Brunei which consumed South Korea is also a fairly developed market, with per person, while Laos, the Philippines, Vietnam and Taiwan also consume over 1kg per person (see Figure 3).
8 Figure 3: Coffee consumption in 2012 in East and Southeast Asia a. Total coffee consumption b. Per capita consumption Japan 7 131 Brunei Indonesia 3 584 Japan Philippines 2 175 South Korea South Korea 1 714 Laos Vietnam 1 583 Philippines China 1 071 Vietnam Thailand* 1 052 Taiwan Taiwan 396 Thailand* Malaysia* 393 Indonesia Myanmar 253 Malaysia* Laos 150 Mongolia Brunei 30 Myanmar Cambodia 28 Cambodia North Korea 25 North Korea Mongolia 16 China Timor-Leste 0 Timor-Leste 0 2 000 4 000 6 000 8 000 0 1 2 3 4 5. Thousand bags kg per capita *Estimated 8. The region as a whole certainly exhibits significant potential for future growth in coffee consumption, both in terms of volume and value. The total population of East and Southeast Asia comes to billion people, which gives an average per capita consumption of just over , whereas the European Union averages nearly 5kg and North America Disposable income is generally growing, and several multinational coffee companies are increasingly investing to expand their presence in the area.
9 9. The next section gives a brief summary of individual markets since 1990. Japan 10. Coffee consumption in Japan grew rapidly in the second half of the 20th century, recording double-digit growth rates in the 1960s and 1970s. However, this growth has slowed over time, as the Japanese market becomes more mature and saturated. Average -5- annual growth rates fell to in the 1980s, in the 1990s and just since 2000. In 2012, coffee consumption was million bags, making it by far the largest coffee drinker in the region, and behind only the USA, Brazil and Germany in the world. Per capita consumption was around per person, and has remained relatively unchanged since 2000. 11. According to export data, the majority of coffee consumption is Arabica, consistently accounting for 70 to 80% of the market over the time period.
10 However, Robusta has been growing more quickly since 2000, at around 4% per annum, while Arabica use has stayed relatively constant. The vast majority of Japan's imports are of green coffee (see Figure 4), at over 90% of the total every year since 1990, which indicates a very strong domestic processing industry. Japan re-exports very little coffee, just 1 to 2% of its total imports, with the remainder consumed domestically. Brazil is the single largest origin, accounting for around 29% of total imports since 2000, followed by Colombia (19%), Indonesia (14%) and Vietnam (10%). However, it is notable that imports from other East and Southeast Asian countries have increased significantly since 2000, by per year, while those from South America have stagnated, and Central America and Africa have fallen.