Transcription of 3.3 Normalised Difference Vegetation Index …
1 Normalised Difference Vegetation Index (NDVI) NDVI: A non-technical overview The Normalised Difference Vegetation Index (NDVI) gives a measure of the vegetative cover on the land surface over wide areas. Dense Vegetation shows up very strongly in the imagery, and areas with little or no Vegetation are also clearly identified. NDVI also identifies water and ice. Vegetation differs from other land surfaces because it tends to absorb strongly the red wavelengths of sunlight and reflect in the near-infrared wavelengths. NOAA satellites (and LANDSAT) measure the intensity of the reflection from the Earth's surface in both these wavelength ranges.
2 The Normalised Difference Vegetation Index (NDVI) is a measure of the Difference in reflectance between these wavelength ranges. NDVI takes values between -1 and 1, with values indicating dense Vegetation and values <0 indicating no Vegetation . NDVI has proved to have an extremely wide (and growing) range of applications. It is used to monitor Vegetation conditions and therefore provide early warning on droughts and famines. Section Using satellite data in Zambia gives details of how NDVI can be used to estimate evapotranspiration.
3 It is also used to identify regions suitable for locust development (see Section Locust prevention ). Finally, techniques are being developed to use NDVI imagery to identify particular ecological zones with important implications for disease prevention (see Section Using satellite data to identify farming systems). Since 1982, NASA has produced NDVI images of Africa three times a month, building up a valuable archive of the conditions in Africa over the period. This allows present conditions to be compared with those in previous years.
4 In Section , we will look at how NDVI images are produced, particularly what satellites they come from and how NDVI is calculated. The products that are available from ARTEMIS will be examined, in Section Although NDVI data has proved to be extremely useful it can only be used properly when the user is aware of the many limitations of the data. These are discussed in Section Finally, although NDVI is the most widely used Vegetation Index , we must not overlook others indices. These are discussed in Section NDVI: How it is produced When the first NOAA satellites were launched, channels 1 and 2 on the AVHRR were designed to monitor clouds, ice and land/water boundaries.
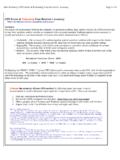
5 More details on the AVHRR are found in Section NOAA satellites. However, researchers quickly realised the two channels could be combined to detect Vegetation using the different reflectance of Vegetation in the two channels. Chlorophyll absorbs light in the red channel 1 ( microns) and foliage reflects light in the near infrared channel 2 ( microns). This is shown in Figure Therefore, higher photosynthetic activity will result in lower reflectance in the red channel and higher reflectance in the near infrared channel. This signature is unique to green plants.
6 Page 1 of 6ndvi8/29/02 ~swsgrime/artemis/ch3/ Figure : Typical reflectance curve for Vegetation , soil and water [Lillesand and Kiefer, 1994] By combining the two channels in a ratio or Difference , allows the response to Vegetation growth to be distinguished from the background signal. The method, developed by NASA is known as the Normalised Difference Vegetation Index (NDVI) and is given by the equation (NIR-RED/NIR+RED), where RED and NIR correspond to channels 1 and 2 respectively. By normalising the Difference in this way, the values can be scaled between a value of -1 to +1.
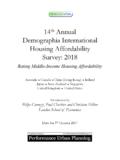
7 This also reduces the influence of atmospheric absorption. Figure shows typical reflectance values in the red and infrared channels, and the NDVI for typical cover types. Water typically has an NDVI value less than 0, bare soils between 0 and and Vegetation over Figure : Typical NDVI values for various cover types [Holben, 1986] NDVI: ARTEMIS products ARTEMIS provides NDVI data for Africa in both the LAC and GAC forms (see Section NOAA satellites. LAC data is received by two stations; by the Centre Agrhymet in Niamey, Niger and by the Department of Meteorological Services in Harare, Zimbabwe.)
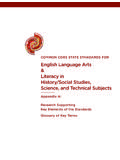
8 An example image is shown in Figure , where the areas of high NDVI are indicated by the blue and green colours. COVER TYPE RED NIR NDVI Dense Vegetation Dry Bare soil Clouds Snow and ice Water Page 2 of 6ndvi8/29/02 ~swsgrime/artemis/ch3/ Figure : LAC image from Harare. When the satellite views an area at any one time, a large part of the image may be cloud, which has a very low NDVI (approximately ). This gives no information on the state of the Vegetation beneath the cloud. This problem can be at least partially solved by using maximum value composite images (known as MVC's).
9 In this process the maximum value is found for each pixel over a time period such as ten days or one month. The maximum pixel value over such an interval is likely to be a cloud-free pixel. The time period is a trade-off: a longer period decreases the amount of cloud interference, but it means missing short-term variations. However, as Vegetation does not change much on a time scale of days, the technique is useful. This process can be carried out using an image analysis packages, such as IDA, described in more detail in Section Image manipulation with IDA.
10 MVC's have the added advantage of reducing the effects of other unwanted influences on the NDVI values (such as atmospheric interference and off-nadir viewing). These will be discussed in Section NDVI: Limitations. For most routine operational purposes a 10-day maximum is normally used. NDVI: Limitations Temporal resolution It is important to get the right balance between the temporal resolution of data and the timescale of variation in the quantity measured. For example, maximum value composites of NDVI data are rarely less than dekadal.