Transcription of 3. Solid Wastes
1 3. Solid Wastes Solid waste conditions Describing the Solid waste conditions in the country involves understanding the composition and sources of Solid Wastes , waste generation rates and waste projection. Sources and composition of municipal Solid waste (MSW) The amount, composition and sources of Solid Wastes generated can be statistically determined through the conduct of waste analysis and characterization studies (WACS). Sources of municipal Solid waste Information on the sources of MSW was provided by a number of EMB Regional Offices in addition to data from submitted SWM plans. The available information from 2008 to 2013 was synthesized and summarized in Figure 3-1.
2 MSW comes from residential, commercial, institutional and industrial sources. Residential waste constitutes the bulk ( ) of MSW and includes kitchen scraps, yard waste , paper and cardboards, glass bottles, plastic containers and sando bags, foils, soiled tissues and diapers, and special Wastes such as containers of household cleaning agents, batteries and waste electrical and electronic equipment (WEEE). Commercial sources which include commercial establishments and public or private markets contribute of which, in some regions, about two- thirds of commercial Wastes come from the latter. Institutional sources such as government offices, educational and medical institutions account for about while the remaining are waste coming from the industrial or manufacturing sector.
3 Page | 1 Figure 3-1. Sources of municipal Solid waste in the Philippines, 2008-2013. Composition of municipal Solid waste Based on available information from Regional State of the Brown Environment reports and various WACS data, the typical composition of MSW in the Philippines is shown in Figure 3-2. Figure 3-2. Composition of municipal Solid waste in the Philippines, 2008-2013. Page | 2 Biodegradable Wastes comprise about half ( ) of MSW although primary data suggest that figures can range from 30% to as much as 78%. Typical bio- waste consists of kitchen or food waste and yard or garden waste . From the available information, it could be estimated that of compostable waste comes from food scraps while are leaves and twigs.
4 Recyclable Wastes account for almost a third ( ) of MSW with an estimated range of to Plastic packaging materials comprise around 38% of this waste fraction and followed by paper and cardboard waste , which contributes about 31%. The remaining 31% is made up of metals, glass, textile, leather and rubber. Special Wastes which consist of household healthcare waste , waste electrical and electronic equipment (WEEE), bulky waste and other hazardous materials contribute a measly with values ranging from negligible up to Finally, residuals have been found to make up of generated MSW. Most LGUs present this data as a combination of disposable Wastes as well as inert materials, which comprise about 12% of the residual waste .
5 waste generation rates waste generation rates have been estimated based on consolidated data generated from waste analysis and characterization studies (WACS) presented in EMB regional reports and selected local 10-year Solid waste Management (SWM) plans. Using 2010 as base year, Table 3-1 summarizes waste generation rates in the Philippines, Metro Manila, highly urbanized cities (HUCs), municipalities and other cities. Table 3-1. Synthesized waste generation rates in the Philippines for the base year 2010. Scope / Coverage Sample size (as % of demographics) Range Weighted Average kg/capita/day Metro Manila (NCR) 100% Metro Manila and some highly urbanized cities (HUCs) N/A Other cities and provincial capitals (excluding NCR/HUCs) N/A PHILIPPINES (Nationwide) 79% All LGUs in the country, excluding Metro Manila 76% Municipalities (cities and N/A Page | 3 Scope / Coverage Sample size (as % of demographics) Range Weighted Average kg/capita/day some capital towns excluded) In 2010, waste generation rates vary from as low as kg/capita/day in the municipalities outside of Metro Manila to kg/capita/day in Metro Manila and HUCs.
6 The rates are dependent on household income, local economic activity and waste avoidance policies and incentives. The average per capita generation rate for the Philippines is kg. waste projection Based on the per capita rate of and annual projected population, the amount of waste generated yearly in the entire Philippines and Metro Manila in terms of tonnage can be seen in Figure 3-3. Figure 3-3. Projected waste generation 2008-2020 (metric tons per year). The figure shows that the yearly amount of waste in the country is expected to increase from million tons in 2010 to million tons in 2014 to million tons in 2020. On the other hand, Metro Manila s waste generation continues to increase as it contributes , Page | 4 and to the country s Solid waste in the years 2010, 2014 and 2020, respectively.
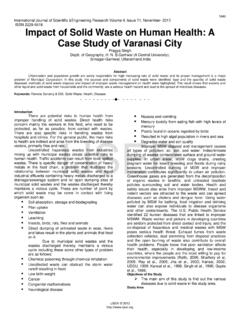
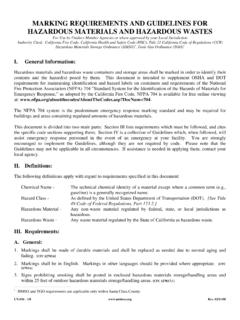
7 Solid waste impacts on health and the environment Improper Solid waste management practices can have a number of environmental and health impacts. The adverse impacts and their causes are shown in Figure 3-4. As discussed earlier, municipal Solid Wastes come from residential, institutional, commercial, and industrial sources. Other sources include illegal dumps, street sweepings and litter and rubbish from roads, open spaces and water bodies. People who live near or within dumpsites are vulnerable to various diseases. Leachate from Solid waste can contaminate groundwater tables and surface waters. Insects and pests in open dumpsites are disease vectors. Methane gases from dumpsites can affect the health of exposed populations and contribute to global warming.
8 Coastal and marine litter affects aesthetics, causes pollution, and harms marine organisms. Improperly managed Solid Wastes also can result in increased flooding and destruction of infrastructures due to clogged waterways. Source: Cost Sharing Framework for SWM, 2010 Figure 3-4. Solid waste exposure pathway. The disease pathway associated with the poor handling of Solid waste becomes manifest usually through direct exposure of humans and the pollution of surface water and groundwater due to leachate from open dumps. The World Health Organization and the World Bank estimate that approximately 88% of diarrhea cases worldwide can be attributed to poor water quality, sanitation, and hygiene. (See Table 3-2).
9 In the same manner, poor water quality, sanitation, and hygiene cause 100% of Page | 5 cholera cases, 100% of helminthiasis cases, 50% of hepatitis cases, and 50% of typhoid and paratyphoid fever cases. Table 3-2. Fraction of disease cases attributable to water, sanitation and hygiene. Disease Attributable Fraction Source Diarrhea 88% WHO Helminthiasis 100% WHO Typhoid & Paratyphoid 50% WB Cholera 100% Widely accepted Hepatitis A 50% WB Sources: WHO, Preventing Disease Through Healthy Environments, 2006; World Bank, Philippine Environment Monitor 2006: Environmental Health. However, there is no established information on the proportion of disease incidence in Table 3-2 that can be attributed solely to Solid waste pollution.
10 A study made on the cost sharing framework for Solid waste management in 2010 has assumed that the proportion of the municipal population within the vicinity of open dumpsites is the population with the highest risk of contracting diseases. If the leachate from dumpsites affect the groundwater and domestic water supply, then the population at risk might be even greater. Thus, the potential population at risk was estimated based on the population of potentially affected barangays surrounding open dumpsites. Using a sample of open dumpsites, it is estimated that an average of 27% of the municipal population might be at risk from water borne diseases due to open dumpsites. Hence, it can be assumed to be the same proportion of diarrhea cases solely attributable to Solid waste pollution.