Transcription of 3D Risk Model Concept - McCormick PCS
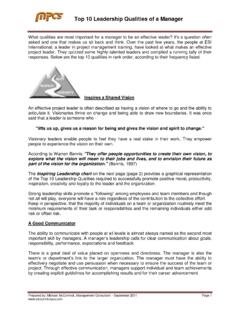
1 3d risk model concept Page | 1 Prepared by: Michael McCormick October 2011 | Independent Management Consultant | Graphically Representing Risk in 3D - Add Velocity to 2 X 2 Framework of Likelihood and Impact Risk Management was one of the dominant themes this year, and with good reason, given a spate of recent events, most noteworthy the supply chain troubles coming from the earthquake in Japan. Risk management was in fact little talked about a decade or so ago, but now it is near the top of every executive's priority list. Many companies have or still use a simple 2 x 2 Framework below for assessing and managing risk, where on one dimension is the likelihood of occurrence (high or low) and the other the level of impact (high or low) or in which risk is rated along two dimensions: likelihood/probability and then impact.
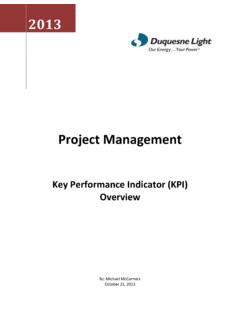
2 2 x 2 Framework Chart Many have taken this same basic Concept and decided that two dimensions (low and high) do not provide enough granularities, and so have simply segmented the two dimensions into more categories, giving a more nuanced breakdown of probability and impact, as shown in the graphic Multi-Level Risk Framework Chart next page, and leading to an even more targeted set of appropriate mitigation strategies. 3d risk model concept Page | 2 Prepared by: Michael McCormick October 2011 | Independent Management Consultant | Multi-Level Risk Framework Chart Companies should consider adding a third variable to the mix velocity. In other words, in addition to likelihood and impact, how fast an event would impact a company is another dimension to consider, and will also impact appropriate mitigation strategies.
3 An event that will be slower to have an impact obviously gives a company more time to respond should it occur. While there is probably some overlap with the velocity dimension with impact/materiality, we agree that adding velocity to the framework makes sense. To do that, keep velocity as a dimension but use another approach to illustrating that graphically. One answer is: Don't try to represent velocity as a third dimension. You are trying to build something overly complex that will likely not be practical. Instead, keep velocity as an overlay to the traditional impact/likelihood risk grid. When you plot the risks on the grid, code them another way to show the velocity (another colored point or a different type of point).
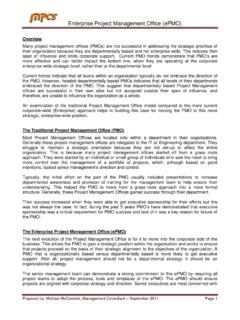
4 Most leading practices show risk velocity in that fashion. 3d risk model concept Page | 3 Prepared by: Michael McCormick October 2011 | Independent Management Consultant | In the Top Ten risks chart below, the two dimensions of likelihood and impact are still used, but now the velocity of each supply chain risk is indicated by using a different color, in a familiar red, yellow, green traffic light type of graphic approach. Top Ten risks Likelihood, Impact & Velocity (Source: Corporate Executive Board) VoR or Velocity of Risk 3d risk model concept Page | 4 Prepared by: Michael McCormick October 2011 | Independent Management Consultant | Understand the probability of loss, adjusted for the severity of its impact, and you have a sure-fire method for measuring risk.
5 Sounds familiar and seems on point; but is it? This actuarial construct is useful and adds to our understanding of many types of risk. But if we had these estimates down pat, then how do we explain the financial crisis and its devastating results? The consequences of this failure have been overwhelming. Enter "risk velocity," or how quickly risks create loss events. Another way to think about the Concept is in terms of "time to impact" a military phrase, a perspective that implies proactively assessing when the objective will be achieved. I`ve seen the use of `risk velocity` or `speed of onset` many times over the past few years, and these concepts tend to attract the attention of senior leaders because they evoke emotional responses but I believe there is little practical value.
6 Adding a third dimension to risk complicates the risk management process and dealing with the two dimensions of likelihood and consequence and their ratings is difficult enough. Outside of the world of risks for which much data exist, the accuracy of likelihood and consequence ratings is subject to perception-bias: both time-relevant (recentness) and personal (a person`s journey through life results in automatic biases of what is and is not relevant). Velocity, speed of onset, and similar measures do not add value to deciding which risk events are most important and which should be treated. These measures do, however, play a critical role in deciding how to treat a risk event. The faster the risk event manifests itself and the quicker consequences are felt, the sooner you need to be able to detect the onset of the risk event and the quicker you must be able to respond to the risk event.
7 Take an earthquake or tornado for example. These events have extremely high velocity from the standpoint of consequences but will we treat them differently than another risk event? Likely not! We`ll base our risk treatment on likelihood of the event and the magnitude of the consequences. So, if the consequences are great, a company could develop a second geographically separated production site as a risk treatment. There may be some value in differentiating risk events with a third dimension using time horizon of when the risk event will occur. Even this method can be problematic, however. A risk event that won`t happen for 5 years may require actions starting today to develop adequate treatment, perhaps to prevent the risk event from happening.
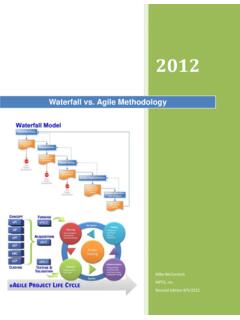
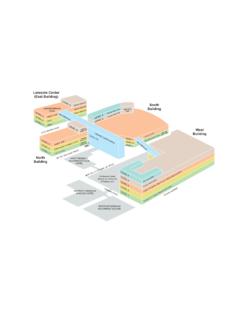
8 Many regulatory risks fall into this category. The 3D Risk Matrix Model on the next page, has never proved practical in use, however, and I don`t condone its use and leave it to your interpretation and consideration. 3d risk model concept Page | 5 Prepared by: Michael McCormick October 2011 | Independent Management Consultant | 3D Risk Assessment Matrix Model Region: geographic region where a particular event can occur Product: product type that may be impacted Scale of Impact: how big the impact could be relative to total Company, primarily an indication of where this particular items fits into the scheme of issues, can be used as a global prioritization factor.
9 The risk assessment process can become semi-automated using a database and applying appropriate decision logic. The highest priority items can be highlighted by region, product, and global. 3d risk model concept Page | 6 Prepared by: Michael McCormick October 2011 | Independent Management Consultant | 1 Year or Less to Impact 1 to 3 Years Out 3d risk model concept Page | 7 Prepared by: Michael McCormick October 2011 | Independent Management Consultant | 3 Years or More Out Risk Prioritization Matrix Incorporating Risk Velocity (Source: Deloitte; Risk Integration Strategy Council Research) Impact What is the maximum business damage this risk could cause?
10 Probability How likely is this risk to materialize? Speed At what speed will this risk impact the organization? RISK A High Severity and Likelihood but Low Speed of Onset Increased employee attrition will have a significant impact on the organization and is very likely to happen. The risk is forecast to materialize across the course of the next 18 months. RISK B High Severity and Likelihood and High Speed of Onset A new competitor will have a significant impact on the organization and is very likely to happen. The risk is forecast to materialize within the next two months when the new competitor begins trading. 3d risk model concept Page | 8 Prepared by: Michael McCormick October 2011 | Independent Management Consultant |