Transcription of 4000 2000 6000 - oecd.org
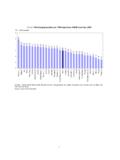
1 Health at a Glance 2011: OECD Indicators 1 WHY IS HEALTH SPENDING IN THE UNITED STATES SO HIGH? 1. Health spending in the United States is much higher than in other OECD countries The United States spends two-and-a-half times more than the OECD average health expenditure per person (Chart 1). It even spends twice as much as France, for example, a country which is generally accepted as having very good health services. At of GDP in 2009, US health spending is half as much again as any other country, and nearly twice the average. Chart 1: Health expenditure per capita, public and private, 2009 (or nearest year) 7960535251444914480843634348428942183978 3946378137223538348734453233322631373067 2983287827242579250821652108208418791511 1394139311861036943918902862308132990200 0400060008000 United StatesNorwaySwitzerlandNetherlands Luxembourg CanadaDenmarkAustriaGermanyFranceBelgium IrelandSwedenIcelandUnited KingdomAustralia OECDF inlandItalySpainNew ZealandJapan Greece SloveniaPortugal IsraelCzech RepublicSlovak RepublicKoreaHungaryPolandEstoniaChileRu ssian South AfricaChinaIndiaIndonesiaUSD PPPP ublic expenditure on healthPrivate expenditure on health 1.
2 In the Netherlands, it is not possible to clearly distinguish the public and private share related to investments. 2. Health expenditure is for the insured population rather than the resident population. 3. Total expenditure excluding investments. Note: Information on data for Israel: Source: OECD Health Data 2011. Health at a Glance 2011: OECD Indicators 2 Chart 2: Total health expenditure as a share of GDP, 2009 (or nearest year) StatesNetherlands FranceGermanyDenmarkCanadaSwitzerlandAus triaBelgium New ZealandPortugal SwedenUnited KingdomIcelandGreece NorwayOECDI relandItalySpainSloveniaFinlandSlovak Japan South AfricaChileCzech HungaryPolandEstoniaKoreaMexicoTurkey Russian of GDPP ublicPrivate 1.
3 In the Netherlands, it is not possible to clearly distinguish the public and private share related to investments. 2. Total expenditure excluding investments. 3. Health expenditure is for the insured population rather than the resident population. Note: Information on data for Israel: Source: OECD Health Data 2011. Rich countries spend more than poor countries. Chart 3 shows that for nearly every country, if you know how rich they are, you can predict their health spending per person per year to within a few hundred dollars. The United States is an exception Americans spend nearly $3000 per person per year more than Swiss people, even though Swiss people have about the same level of income.
4 Chart 3: Total health expenditure per capita and GDP per capita, 2009 (or nearest year) AUSAUTBELBRACANCHLCHNCZEDNKESTFINFRADEUG RCHUNIDNINDISLIRLISRITAJPNKORLUXMEXNLDNZ LNORPOLPRTRUSSVKSVNZAFESPSWECHETURGBRUSA R = per capita (USD PPP)Health spendingper capita (USD PPP) Source: OECD Health Data 2011. Health at a Glance 2011: OECD Indicators 3 2. Where does the money go? Health expenditure can be broken down into different categories of spending by type of care, that is, in-patient care, out-patient care, pharmaceuticals, public health and administration, etc. Chart 4 shows how the US compares to other OECD countries that spend a lot on health, including countries with a lot of private insurance (Switzerland, France and Germany).
5 Chart 4: Health spending per capita by category of care, US and selected OECD countries, 2009 $2,922 $2,716 $1,643 $1,518 $1,639 $1,458 $2,803 $1,626 $1,171 $1,254 $1,062 $787 $1,070 $463 $860 $887 $842 $466 $803 $339 $434 $271 $298 $121 $7,598 $5,144 $4,139 $4,072 $3,872 $2,832 $-$1,000 $2,000 $3,000 $4,000 $5,000 $6,000 $7,000 $8,000 UNITED STATESS witzerlandCanadaGermanyFranceJapan (2008)USD PPPO therPublic health & administrationPharmaceuticals and medical goodsAmbulatory (Physicians, specialists, dentists, etc.)Hospitals/Nursing homes(163%)(238%)(152%)(274%)(189%) Note: Health spending excludes investments. The percentages in the US bar indicate how much more the US spends per category compared with the average of the five other OECD countries.
6 Source: OECD Health Data 2011. Hospital spending is higher than in the five other OECD countries, by over 60%. Spending on Ambulatory care providers that is, physicians and specialists as well as dentists, is much higher than in the other OECD countries almost two-and-a-half times the average of the other five countries. One of the explanations for this is the growth of same-day surgery in the US. Such services are an important innovation in health care delivery, often being preferred, when possible, by patients to staying overnight in a hospital. Estimates of spending on same-day surgery performed by independent physicians for 2003 and 2006 suggest that this has been the fastest growing area of health care over this period (Mckinsey Global Institute, 2008).
7 Spending on Pharmaceuticals and medical goods is higher in the US than in any other country, but overall accounts for a smaller share of total health spending than in the other countries. Spending on Public Health and Administration is particularly high more than two-and-a-half times the average. Administration of the US health system alone accounts for about 7% share of total spending. This is on a par with other systems such as France and Germany which also have multipayer systems (even if in some of them there is no or little competition across payers). In comparison, Canada and Japan devote around 4% of health spending on administration. Health at a Glance 2011: OECD Indicators 4 Leaving aside spending on administration, the high level of spending in the United States may be due to: The cost (or price) of health care being higher in the United States than elsewhere The United States providing more health care more doctors appointments, more surgery, more drugs, more diagnostic tests, longer stays in hospital than in other countries Some combination of the two.
8 Evidence suggests that prices are high (see next section) and some (but not all) quantities of services provided are high. 3. Are US health prices high? A 2010 OECD study (Koechlin et al., 2010) found the US price level of hospital services to be over 60% higher than the average of 12 other OECD countries in Looking at specific interventions, Table 1 shows that the price of a normal delivery in the United States was estimated to be more than 50% higher than in France or Canada, while the price of a caesarean section was 30% higher than in France and more than 50% higher than in Canada. The price of a knee replacement was about 20% higher in the United States than in France and 50% higher than in Canada, while a hip replacement costed 45% more in the United States than in these two countries.
9 Table 1: Average unit quasi-prices of certain hospital procedures, in US dollars, US and selected OECD countries, 2007 Procedures AUS CAN DEU FIN FRA SWE USA Appendectomy 5 044 5 004 2 943 3 739 4 558 4 961 7 962 Normal delivery 2 984 2 800 1 789 1 521 2 894 2 591 4 451 Caesarean section 7 092 4 820 3 732 4 808 5 820 6 375 7 449 Percutaneaous transluminal coronary angioplasty (PTCA) 7 131 9 277 3 347 5 574 7 027 9 296 14 378 Coronary artery bypass graft 21 698 22 694 14 067 23 468 23 126 21 218 34 358 Hip replacement 15 918 11 983 8 899 10 834 11 162 11 568 17 406 Knee replacement 14 608 9 910 10 011 9 931 12 424 10 348 14 946 Source: Koechlin et al.
10 (2010). Pharmaceutical prices are also higher in the United States than in other OECD countries. A recent study of the 50 top-selling prescription drugs found that US pharmaceutical prices were at least 60% higher than those in five large European countries in Overall, the evidence suggests that prices for health services and goods are substantially higher in the United States than elsewhere. This is an important cause of higher health spending in the United States. 1 Koechlin, F., L. Lorenzoni and P. Schreyer (2010), Comparing Price Levels of Hospital Services across Countries: Results of a Pilot Study, OECD Health Working Paper, No.