Transcription of 5 Break-even analysis (CVP analysis) - acornlive.com
1 1 Break-even analysis (CVP analysis ) Chapter 5 2 Introduction Cost-volume-profit (CVP) analysis looks at how profit changes when there are changes in variable costs, sales price, fixed costs and quantity. It is a good example of what if? analysis and it in particular looks at sales minus variable costs which is known as contribution. It allows management to understand the level of sales needed to cover all costs of a project and what level of sales is needed start making profits. To break even would mean an organisation would be earning no profit and no loss. Sales revenue = All variable and fixed cost Main assumptions in this model are that selling price, fixed costs and variable costs are constant.
2 Formulae to learn Contribution per unit = sales price per unit less variable cost per unit Break-even volume = Fixed overhead Contribution per unit The number of units you would need to sell in order to earn enough contribution to cover the fixed overhead the number of units sold where the contribution would equal the fixed overhead. The contribution to sales ratio (C/S ratio) The contribution to sales (or C/S) ratio (also called the profit-volume or P/V ratio) would calculate how much contribution a product would earn for every 1 of sales generated, expressed as a decimal or percentage.
3 For example a or 40% C/S ratio, would mean 40 pence of contribution is earned for every 1 of sales generated. C/S ratio = Contribution per unit Sales price per unit C/S ratio = Total contribution Total sales revenue 3 Break-even revenue The sales revenue earned that would give no profit and no loss. It can be calculated by multiplying the Break-even volume (above) by the products selling price, or alternatively by using the following formulae. = Fixed overhead C/S ratio Margin of safety Measures the sensitivity of the budgeted sales volume compared with the Break-even sales volume.
4 The difference between the level of sales activity achieved and the level of sales activity required to Break-even in absolute or percentage terms. Margin of safety (units) = Budgeted sales volume less Break-even sales volume Margin of safety (%) = Budgeted sales less Break-even sales volume x 100 Budgeted sales volume Number of units sold to achieve a target profit = Fixed cost + Target profit Contribution per unit 4 Break-even charts Indicates graphically profit and losses at different levels of sales volume achieved.
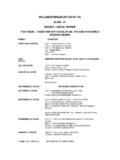
5 Output (units) Margin of safety Budgeted or actual sales Break- even point Sales revenue Total costs Variable costs Fixed costs Cost and revenue 0 Where sales revenue is greater than total cost it means that profits are being generated. Where sales revenue is less than total cost it means that losses are being incurred. Where sales revenue equals total costs (intersection of the sales revenue line and total costs line) it means that no profit or loss is occurring. This is the Break-even point. Variable costs vary directly with output, as more output is produced then more variable costs are incurred. Fixed costs do not vary with output and are constant for a range of output produced.
6 They are incurred even when there is no output at the beginning of production. This is because they are costs that must be incurred to support manufacture such as machinery or a warehouse. The total costs line is a representation of the combined variable and fixed costs. This is why at nil output it has a cost which represents fixed costs, and then as output increases the total cost line varies with it and in parallel with the variable cost line. The margin of safety is the extra amount of sales that is expected to be generated when the budget or actual sales is compared to the break even level of sales. 5 Profit volume charts A variation of a Break-even chart, indicating graphically the relationship between profit and losses at different levels of sales volume achieved.
7 Loss = fixedcosts at zerosales activityBreak-evenpointSalesLoss Profit0 The profit volume chart is a summarisation of the break even chart, whereby the line represents total profit (sales less all costs). When the line rises above the horizontal axis it means that production is beginning to yield a profit, before this point it means that production is yielding a loss. The break even point where no profit or loss is being made is where this profit line intersected the horizontal axis. Assumptions 1. Single product or single mix of products 2. Fixed cost, variable cost and selling price are constant 3. The level of production will equal the level of sales 6 Example (CIMA P2 Nov 07) Diagram showing costs and revenues over a range of activity levels 7 You are required to interpret the diagram and explain how it illustrates issues that the operational managers should consider when making decisions.
8 (Note: your answer must include explanations of the Sales Revenue, Total Cost and Fixed Cost lines, and the significance of each of the activity levels labelled A, B, C, D). Example Z-Boxes sell for 299 and their variable production cost is 99. The research and development, and fixed production overheads for the year are million. a) Calculate the Break-even level of sales volume and revenue? b) Calculate the Break-even revenue using C/S ratio? c) The budget revenue is million; calculate the margin of safety in units and as a percentage? d) Produce a Break-even chart and profit-volume chart using the information above? e) How many Z-Boxes must be sold to achieve 500,000 profit 8 Multiple product scenarios Break-even analysis can also be used to work out either a Break-even volume or revenue, given a multiple product scenario.
9 This is achieved using the average contribution per unit or average C/S ratio per unit for all products together. This calculation will only work providing the sales mix remains constant. Change the mix and the C/S ratio or contribution per unit of the mix of the products will change; hence you would need to again work out the Break-even volume or revenue. Example Me ole cock spaniel plc makes 3 products, details as follows: Apples ( ) Pears ( ) Cockneys ( ) Selling price 60 80 40 Variable cost (20) (30) (20) Contribution 40 50 20 Sales (units) 2,000 3,000 5,000 Fixed overhead for the year 800,000 Calculate the Break-even level of sales?
10 Example (CIMA P2 May 07) A company provides a number of different services to its customers from a single office. The fixed costs of the office, including staff costs, are absorbed into the company s service costs using an absorption rate of $25 per consulting hour based on a budgeted activity level of 100,000 hours each period. Fee income and variable costs are different depending on the services provided, but the average contribution to sales ratio is 35%. Calculate the breakeven fee income? 9 Key summary of chapter Cost-volume-profit (CVP) analysis looks at how profit changes when there are changes in variable costs, sales price, fixed costs and quantity.