Transcription of 7. Evaluating Transportation Benefits - vtpi.org
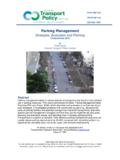
1 Transportation Cost and Benefit Analysis II Evaluating Transportation Benefits Victoria Transport Policy Institute ( ) 10 December 2015 Page 7-1 7. Evaluating Transportation Benefits This chapter discusses techniques for quantifying Transportation Benefits , including Benefits of marginal cost savings, external Benefits , consumer surplus Benefits , economic productivity and development, and Benefits of Transportation diversity. Chapter Index Chapter Index .. 1 Introduction to Transportation Benefits .. 1 Benefits and 2 Consumer Surplus Analysis .. 2 Transport Affordability .. 5 External Benefits and Costs .. 6 Economic Productivity and Development Benefits .. 8 Benefits by Mode .. 9 Information Resources .. 11 Introduction Accessibility (people s ability to reach desired activities) and mobility (physical movement) provide Benefits to society, including direct Benefits to users (people engaged in the transport activity) and external Benefits .
2 Most economic and social activities involve transport and some, such as a life-saving trip to a hospital or delivery of a valuable goods, have extremely large Benefits . However, the existence of such Benefits does not mean that all travel provides net Benefits ( Benefits exceed costs) nor that increased mobility is necessarily desirable. Beyond an optimal level, additional mobility provides declining and eventually negative marginal Benefits . Nobody would spend all their time and money on travel, nor should a community devote excessive resources to transport facilities. As an analogy, people must eat to live but that does not mean that increased eating is always desirable, that current diets are optimal, or that society should subsidize all foods. At the margin ( , relative to current consumption) many people are better off eating less because overeating is unhealthy, and consuming less food leaves more resources for other beneficial goods, including healthier foods (improve quality).
3 Transportation net Benefits tend to be maximized by policies tha reflect market principles, such as consumer choice, efficient pricing and economic neutrality, as discussed in Chapter 3. These principles favor higher value trips and more efficient modes over lower-value trips and inefficient modes, and discourage travel in which Benefits are less than total costs. More optimal transport markets, with efficient road and parking pricing and more neutral planning practices are likely to increase total Benefits while reducing total vehicle 1 EU (1996), Towards Fair And Efficient Pricing in Transport, European Union ( ); Todd Litman (2007), Socially Optimal Transport Pricing and Markets, VTPI; at ; Market Reforms, Online TDM Encyclopedia, VTPI, at Transportation Cost and Benefit Analysis II Evaluating Transportation Benefits Victoria Transport Policy Institute ( ) 10 December 2015 Page 7-2 Benefits and Costs Critics sometimes argue that Transportation cost research is anti-automobile or ignores the Benefits of mobility, as discussed in Chapter 8, but this reflects a misunderstanding of the relationships between Benefits and costs.
4 Benefits and costs tend to have a mirror-image relationship: Benefits can be defined as a reduction in costs, and costs can be defined as reduced Benefits . Transport Benefits are often measured based a reductions in transport costs. For example, roadway expansion Benefits are calculated based on the reduction in travel time and vehicle costs they provide. Vehicle safety improvement Benefits are measured in terms of reduced crash injuries and deaths. As a result, transport economic analysis generally starts by quantifying costs. Standard models are available for calculating highway and transit improvement Benefits , based on reductions in travel time, vehicle operation and crash risk However, these models overlook some significant costs (see discussion in Chapter 3). For example, most ignore parking cost savings that result when travelers shift from automobile to an alternative mode, or the reductions in crash costs that result when motorists reduce total vehicle travel.
5 As a result, such models tend to undervalue alternative modes and mobility management Consumer Surplus Analysis Direct Transportation Benefits can be evaluated using consumer surplus analysis, which refers to the value consumers place on consuming a good (in this case, mobility can be considered a consumer good).4 For example, if in a particular situation you would willingly pay up to $10 to reach a particular destination, but your actual cost is $4, you would enjoy net Benefits worth $6. If another person were only willing to pay up to $5 for the same trip, their net benefit would be $1. The total consumer surplus of the two trips would be $7. This represents travel demand, that is, the amount and type of travel that people would consume under specific conditions. When Evaluating consumer surplus, Benefits from trips that would occur anyway are calculated at their full value, and Benefits from trips that occur as a result of reduced costs are calculated using the rule of half, as described in the box on the following page.
6 For example, a 50 per trip transit fare reduction would provide a $500 consumer surplus gain from 1,000 transit trips that would have been made anyway (1,000 x 50 ), and a $100 consumer surplus gain if this price reduction resulted in 400 additional transit trips (400 x 50 x ). 2 TTI (1997), MicroBENCOST, Texas Transportation Institute ( ); World Bank (2000), Highways Design and Maintenance (HDM) 4 Model, World Bank ( ). 3 Comprehensive Transportation Planning, Online TDM Encyclopedia ( ). 4 Kenneth Small (1999), Project Evaluation, in Transportation Policy and Economics, Brookings ( ); DfT (2003), National Transport Model, UK Dept. for Transport ( ); at Transportation Cost and Benefit Analysis II Evaluating Transportation Benefits Victoria Transport Policy Institute ( ) 10 December 2015 Page 7-3 Explanation of the Rule of Half Economic theory suggests that when consumers change their travel in response to a financial incentive, the net consumer surplus averages half of their price change (called the rule of half ).
7 This takes into account total changes in financial costs, travel time, convenience and mobility as perceived by consumers. Let s say that vehicle operating costs increased by 10 per mile due to higher fuel prices, road tolls or parking fees, and as a result you reduced your annual vehicle use by 1,000 miles. You would not give up highly valuable vehicle travel but there are probably some lower-value vehicle-miles that you would reduce by shifting modes or choosing closer destinations. These vehicle-miles foregone have an incremental value to you, the consumer, between 0 and 10 . If you consider the additional mile worth less than 0 ( , it has no value), you would not have taken it in the first place. If its worth is between 1-9 per mile, a 10 per mile incentive will convince you to give it up you would rather have the money. If the additional mile is worth more than 10 per mile, a 10 per mile increase is inadequate to convenience you to give it up you ll keep driving.
8 Of the 1,000 miles foregone, we can assume that the average net benefit to consumers (called the consumer surplus) is the mid-point of this range, that is, 5 per vehicle mile. Thus, we can calculate that miles foregone by a 10 per mile financial incentive have an average consumer surplus value of 5 . A $100 increase in vehicle operating costs that reduces automobile travel by 1,000 miles imposes a net cost to consumers of $50, while a $100 financial reward that convinces motorists to drive 1,000 miles less provides a net benefit to consumers of $50. Some people complicate this analysis by trying to track individual changes in consumer travel time, convenience and vehicle operating costs, but that is unnecessary information. All we need to know to determine the net consumer Benefits and costs is to know the perceived change in price, either positive or negative, and the resulting change in consumption.
9 This incorporates all of the complex trade-offs that consumers make between money, time, convenience and the value off mobility. The following factors should be considered when Evaluating the consumer surplus Benefits of Transportation activities and improvements. Consumer Benefits tend to decline as personal mobility increases since rational consumers choose more valuable travel over lower value travel, so additional mobility consists of trips that consumers consider less valuable and are most willing to forego if constrained by price, time costs or discomfort. For example, a certain amount of mobility (say, the first 5,000 annual miles of vehicle travel) tend to provide large Benefits because this will consist of consumer s most valuable trips, but each additional thousand miles of travel provides less benefit because it consists of increasingly lower value travel.
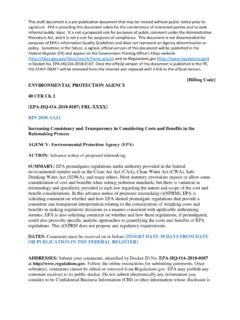
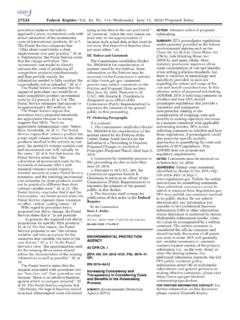
10 Travel demand tends to have a long tail, meaning that if user costs (including money, time, discomfort, etc.) decline, consumers can find reasons to increase their consumption. For example, if travel costs were low enough (for example, if somebody else paid for first class service), many consumers would regularly travel to other continents or accept long-distance commutes, even if their net Benefits are modest. To the degree that this travel is Transportation Cost and Benefit Analysis II Evaluating Transportation Benefits Victoria Transport Policy Institute ( ) 10 December 2015 Page 7-4 underpriced (subsidized or imposes external costs), an increasing portion of this travel has negative net costs (total Benefits are smaller than total costs). Figure 11 Travel Demand Curve HigherValueTravelMediumValueTravelLowVal ueTravelCost Per MileTravel DemandTotal CostsPrice (Internal Costs)External CostsConsumer Surplus Travel demand curves tend to have long tails: as prices decline mobility increases even if the additional travel provides little incremental Benefits and imposes significant external costs.