Transcription of 700 bar Type IV H2 Pressure Vessel Cost Projections - Energy
1 700 bar Type IV H2 Pressure Vessel Cost ProjectionsBrian D. James and Cassidy HouchinsDepartment of Energy Physical-Based Hydrogen Storage Workshop:Identifying Potential Pathways for Lower Cost 700 Bar Storage Vessels24 August 2016 USCAR, Southfield, MIOutline System design Cost analysis methodology Cost Projections Key opportunities for cost reduction Recent focus areas Composites BOP Winding time2 Overview assumptions & results of latest cost analyses Categorize potential pathways for cost reduction Provide framework and reference base for workshop discussionsObjectiveSystem Diagram System cost based on a single tank configuration balance of tank includes: Integrated in-tank valve Integrated Pressure regulator block3 Type 4 carbon fiber composite Vessel with plastic linerCost Reduction Strategies: System simplification Multi-functionality Part standardizationApproach:SA s DFMA -Style Costing Methodology DFMA (Design for Manufacture & Assembly) is a registered trademark of Boothroyd-Dewhurst, Inc.
2 Used by hundreds of companies world-wide Basis of Ford Motor Co. design/costing method for the past 20+ years SA practices are a blend of: Textbook DFMA , industry standards and practices, DFMA software, innovation, and practicalityEstimated Cost = (Material Cost + Processing Cost + Assembly Cost) x Markup FactorManufacturing Cost AmortizationMethodology Reflects Cost of Under-utilization:Annual Minutes of Equipment OperationCapital CostInstallationMaintenance/Spare Parts UtilitiesMiscellaneousOperating ExpensesInitial ExpensesUsed to calculate annual capital recovery factor based on: Equipment Life Interest Rate Corporate Tax RateAnnual Capital Repayment+Annual Operating payments =Machine Rate ($/min)4 Production Volume Range of Analysis:10,000 to 500,000 H2 storage systems per year5 Manufacturing Flow Diagram700 bar, Type IV Pressure Vessel Systems*Black indicates processes assumed for production at 500k systems/yearSystem Bill of Materials(700 bar, usable, Single Vessel )6 Single-Tank ConfigurationDual-Tank Configuration10,00030,00080,000100,00050 0,00010,00030,00080,000100,000500,000 Liner Blow Mold$/kWh$ $ $ $ $ $ $ $ $ $ Cost/tank$/tank$ $ $ $ $ $ $ $ $ $ Liner Annealing$/kWh$ $ $ $ $ $ $ $ $ $ Cost/tank$/tank$ $ $ $ $ $ $ $ $ $ Fiber Winding (Wet Winding)$/kWh$ $ $ $ $ $ $ $ $ $ Cost/tank$/tank$2, $2, $2, $1, $1, $1, $1, $1, $ $ B-Stage Cure (Cure #1)
3 $/kWh$ $ $ $ $ $ $ $ $ $ Cost/tank$/tank$ $ $ $ $ $ $ $ $ $ Tank Shoulder Foam$/kWh$ $ $ $ $ $ $ $ $ $ Cost/tank$/tank$ $ $ $ $ $ $ $ $ $ Full Cure$/kWh$ $ $ $ $ $ $ $ $ $ Cost/tank$/tank$ $ $ $ $ $ $ $ $ $ Boss$/kWh$ $ $ $ $ $ $ $ $ $ Cost/tank$/tank$ $ $ $ $ $ $ $ $ $ Hydro Test$/kWh$ $ $ $ $ $ $ $ $ $ Cost/tank$/tank$ $ $ $ $ $ $ $ $ $ He Fill & Leak Test$/kWh$ $ $ $ $ $ $ $ $ $ Cost/tank$/tank$ $ $ $ $ $ $ $ $ $ balance of Plant (BOP) Items$/kWh$ $ $ $ $ $ $ $ $ $ Cost/system$/system$1, $1, $ $ $ $2, $1, $1, $1, $ System Assembly$/kWh$ $ $ $ $ $ $ $ $ $ Cost/system$/system$ $ $ $ $ $ $ $ $ $ Total System Cost$/kWh$ $ $ $ $ $ $ $ $ $ Total System Cost$/system$4, $3, $3, $2, $2, $4, $4, $3, $3, $2, Tank Cost$/kWh$ $ $ $ $ $ $ $ $ $ Cost per Tank$/tank$2, $2, $2, $2, $1, $1, $1, $1, $1, $1, System Cost vs.
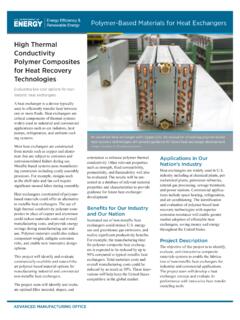
4 Manufacturing Rate7 Cost Reduction Strategies: Increase production rate Single tank instead of multiple tanksStatus and Key Areas for Cost Reduction Fiber and BOP costs dominate Cost reductions should address: Carbon Fiber Reduced CF costs ( precursor or processing cost reductions) Improved material utilization ( winding patterns) BOP Increased component integration Parts reduction Winding time not a large cost contributor810k Systems per year: $ Systems per year: $ Fiber Production CostsUnits20k vehicles per year350k vehicles per yearPrecursor Production Capacity (singlelarge plant)tonnes/year7,5007,500 PrecursorRequired for CF Production Volumetonnes/year3,30055,000 Precursor Cost (spun PAN fibers)$/kg$ $ Precursor to Production Volumetonnes/year1,50025,000 Cost of Precursorper kg CF$/kg CF$ $ Processing Cost$/kgCF$ $ Cost (no markup)$/kg$ $ Precursor production is under-sized at high CF production volume Precursor cost contributes ~50% of the total CF costCost Reduction Strategies: Reduce precursor material cost ($/kg) Increasing precursor to CF conversion efficiency (kg precursor/kgCF) Increase production volumes (economies of scale)Composite Reduction Through Material Utilization10 Winding PatternResinCF Volume FractionComposite MassTank CostBOP& AssemblyTotal Cost[%][kg][$/kWh][$/kWh][$/kWh] Vinyl cost reduction strategies.
5 Eliminate high-angle helical windings using an alternate liner geometry with sharp transitions from cylinder to dome Alternate winding scheme with oOne helical layer over the entire liner oConcentrated hoop winding over the cylinder oHoop/helical winding over cylinder and dome Alternate boss design with a smaller diameter boss and longer flange Higher strength T720 vs T700 CF (cost impact not currently modeled) Reduction Through Reduced Fiber and Manufacturing Variations11 T-700 has a COVfiberof Limited test samples from pilot line production have shown high fiber COVs of 7% adding almost 6 kg of CF ($ ) Fiber variations are expected to be lower at full production scale = + Cost Reduction Strategies: R&D to lower COV during tank winding and/or during CF manufacture Lower Safety FactorIntegrated BOP functionality and lower cost materials reduce system costIntegrated in-tank valveIntegrated Pressure regulator block12 Part Count10ksys/yr[$/kWh]500k sys/yr[$/kWh]IntegratedIn-TankValve9 (integrated into singleunit) (integrated into singleunit) (tubing,mount, etc.)
6 BOP Adds ~$ for Two-Tank Configuration13 Single-Tank[$/kWh]Two-Tank[$/kWh]Integra ted Regulator$ $ In-Tank Valve$ $ (Tubing, Fittings, Mounting Frame, TPRD)$ $ $ $ Reduction Strategies: System simplification Single vs. multiple tanks Multi-functionality Part standardization Share valve among tanks Lower cost polymers/alloysIncreasing Winding Speed Leads to Modest Cost Reductions14 Winding is ~ of system cost for current model at 26 m/min System cost reductions possible (~2-4%) by increasing winding speed One winding line can supply around 1,500 tanks per year 300 production lines required for 550k systems/year Reduction in # of prod. lines is compelling reason alone to increase speed Manufacturing floor space and labor would be the main savings from improving winding speedCost Reduction Strategies: Decrease winding time (limited savings) Advanced forming techniques (perhaps something radically different)Summary Carbon fiber Largest single cost item at all volumes studied (45% -62% of system cost)
7 The cost of precursor and of converting the precursor to carbon fiber contribute approximately equally to the finished carbon fiber cost Strategies to address CF cost could include reduction in Precursor cost Time to convert precursor fibers to CF Total precursor required Fiber variations must be controlled in new fiber development programs balance of Plant Further part count reduction through component integration Lower cost materials Manufacturing Increased winding speed will not have a significant impact on system cost, but would address the significant time to manufacturing tanks15 System System simplificationto reduce part counts and reduce manufacturing costPressureVesselCarbon Fiber/Composite Reduce CF precursor cost $/kg New materials with lower $/kg Reduce CF usage Increase strength/performance Stronger fibers Higher translation High temperature resins to allow fast fill temperature riseManufacturing Advanced forming techniques Something radically different Fast cure and/or low cost resins Lower manufacturing COV Lower Safety Factor (demonstrate safety at lower SF) Increase production rate, market size Decrease winding time (limited savings)
8 Multi-head winding, pre-preg, Plant Multi-functional components Lower cost metals/materials-of-construction Standardized equipment Port sizes/diameters, connection type, material selection, InfrastructureFunctionalityPlacement Better utilization and lower cost if placed at station rather than placed on vehicle Sensors, pumps, electronics, heat exchangers , Concepts Systems that efficiently pre-cool hydrogen Systems that can handle flow rate surge of fast fillingPV Insulation Avoid vacuum insulation (that require gas tight welds and/or maintenance) Develop low-k (and inexpensive) insulation Develop automated insulation lay-up techniques Load bearing vs. non-load bearing insulation16 Summary of Cost Reduction StrategiesBackup Slides17 System Cost Breakdown1810k Systems per year500k Systems per yearSingle-TankTwo-TankBOP Bill of Materials19 Single-TankConfigurationTwo-Tank ConfigurationAnnual Manufacturing RateSys/Year10,00030,00080,000100,000500 ,00010,00030,00080,000100,000500,000 Integrated In-Tank Valve Per Tank$447 $325 $261 $247 $178 $759 $563 $458 $437 $327 TPRD (1)Per Tank$31 $27 $23 $22 $16 $62 $53 $46 $44 $33 Excess Flow Valve (1)Per Tank$40 $32 $28 $27 $21 $80 $64 $55 $53 $41 Filter (1)Per Tank$27 $22 $20 $19 $16 $54 $45 $40 $39 $32 Manual Override (1)Per Tank$6 $5 $5 $5 $5 $12 $11 $10 $10 $10 Temperature Sensor (1)Per Tank$43 $29 $21 $20 $12 $87 $58 $42 $39 $25 Auto Solenoid Valve (1)Per Tank$105 $77 $64 $62 $48 $211 $154 $128 $123 $97 Valve Body (1)Per Tank$19 $16 $15 $15 $14 $38 $32 $30 $30 $27 Insulated Leadwire Sealing Fitting (1)Per Tank$29 $20 $15 $13 $8 $59 $40 $29 $27 $16 Valve Integration and Test (1)
9 Per Tank$9 $8 $8 $8 $7 $18 $17 $16 $16 $15 Check Valve (1)Per System$44 $29 $21 $19 $11 $44 $29 $21 $19 $11 High Pressure Transducer (1)Per System$94 $60 $41 $37 $20 $94 $60 $41 $37 $20 Integrated Pressure RegulatorPer System$586 $396 $327 $302 $209 $586 $396 $327 $302 $209 Integrated Pressure Regulator BlockPer System$33 $10 $12 $11 $8 $33 $10 $12 $11 $8 Pressure Regulator (1)Per System$204 $164 $164 $153 $127 $204 $164 $164 $153 $127 PRV (1)Per System$92 $58 $39 $35 $18 $92 $58 $39 $35 $18 Low Pressure Transducer (1)Per System$55 $35 $24 $22 $13 $55 $35 $24 $22 $13 Manual Defuel Valve incl. "Defuel Recep." (1)Per System$87 $55 $37 $34 $17 $87 $55 $37 $34 $17 Low Pressure Automated Shutoff Valve (1)Per System$115 $74 $51 $47 $26 $115 $74 $51 $47 $26 Other (tubing, mount, etc.)Per System$770 $541 $413 $387 $262 $991 $688 $518 $485 $321 Fuel Tank Controller (1)Per System$138 $117 $101 $97 $76 $138 $117 $101 $97 $76 Pipings/Fittings for first tankPer System$91 $68 $61 $59 $51 $91 $68 $61 $59 $51 Pipings/Fittings per additional tankper addtl tank$0 $0 $0 $0 $0 $35 $30 $27 $26 $23 Plug and TPRD (1)Per tank$140 $89 $59 $54 $28 $280 $177 $118 $108 $55 Fill Receptacle (incl.)
10 IR Transmitter) (1)Per System$195 $124 $83 $76 $40 $195 $124 $83 $76 $40 Mounting Frame (1)Per Tank$45 $29 $19 $17 $9 $91 $58 $38 $35 $18 MiscellaneousPer System$161 $114 $90 $84 $58 $161 $114 $90 $84 $58 BOP Subtotal$/System$1,804$1,264$997$936$651 $2,335$1,648$1,300$1,224$857 BOP Subtotal$/kWh$ $ $ $ $ $ $ $ $ $ & Progress: 700 bar type IV H2storage system cost reduction identified20*Cost at 500,000 systems per year2122