Transcription of 8 Product and portfolio analysis - lostlagoon.info
1 8 Product and portfolio analysisOBJECTIVESTo investigate the competitive position of your business s products or strategic businessunits (sbus) in the context of market development. By displaying products or a portfolio ofproducts in a matrix fashion, insight is gained into the strategic position of the products,the likely direction in which they are developing, the cash flow implications and pointersas to what strategies should be analytical approachescovered in this chapter are: Experience curve and scale economies Product life cycle stage analysis Growth-share matrix Directional policy matrix Hofer matrixPortfolio analysis is mostly relevant for existing, larger businesses with multiple such businesses, matrix displays are helpful in making strategic decisions about theallocation of limited cash resources among a portfolio of products.
2 Some products requirefurther cash investments, some generate cash and others may have to be divested. This isan input into the generation of strategic options, which is addressed in Chapter displays can be generated for your business as well as for competitors. The displayscan be used to make strategic comparisons between your business and competitors. Thisallows you to anticipate likely strategic moves by competitors and plan your own EXPERIENCE CURVE AND ECONOMIES OF SCALEIn most businesses, there is a relationship between volume and cost as a result of twofactors: the experience curve and economies of scale by the Boston Consulting Group, a business consulting firm, showed that there isa relationship between cumulative production volume and unit costs.
3 Unit costs decline ina predictable manner as the cumulative quantity produced over time increases. Themathematics of the experience curve and its application in forecasting are discussed inChapter 12. The main reason for the experience curve effect is that the organisation andpeople within the organisation learn how to do things better. Initially, substantial benefit isderived from this learning process, but it diminishes over time. It should be noted that thiseffect does not depend on production volumes increasing. Even if production remainsstatic, over time costs will of scale effects occur when production volumes increase. There are severalreasons for scale effects: 65 Fixed and overhead costs can be distributed over a larger number of units.
4 Plant and machinery may operate more efficiently at larger volumes. Increased bargaining power vis- -vis suppliers. Increased specialisation. Potentially a higher utilisation of practice, the experience curve effect and the economies of scale effect work a new Product is launched volumes are small, but they increase rapidly. If acompany achieves higher production volumes more quickly than its rivals, it willexperience lower unit costs. As a result, it could offer lower prices, thus increasing marketshare even further (see Chart ). Therefore market share is of overriding importancewhen assessing the strategic imperatives of Product life cycle, portfolio and important aspect of portfolio analysis , which is discussed in detail below, is marketshare.
5 The importance of market share in a mass market derives from the ability to pursuea cost leadership strategy and thus achieve higher overall returns on investments becauseof high-volume sales. Market share is therefore a key determinant of business LIFE CYCLE STAGE ANALYSISThe growth pattern for many products follows an s-shaped curve, from an introductionstage, through growth, then reaching maturity and eventually declining when the productis being replaced with substitutes. A similar life cycle can be observed for whole industries(see Chapter 7). The Product life cycle concept has several uses, notably for marketforecasting, which is covered in Chapter 12. This chapter discusses the Product analysis andbusiness planning implications of the Product life cycle the introduction to the withdrawal ofa Product , customer, demand, marketing,competitive and resource factors generally follow a pattern that is driven by the productlife cycle.
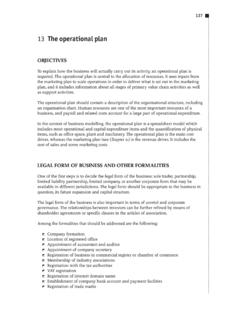
6 Knowing where a Product is in the Product life cycle allows you to anticipateand plan for the next stage. Chart summarises the Product life cycle characteristics andthe impact on strategy. Experience effectScale economiesLower costHigher market shareHigher volumeChart The virtuous circle of volume and cost8. Product AND portfolio ANALYSIS66 Chart life cycle characteristics and strategiesIntroductionGrowthMaturityDecl ineUsers/salesFewIncreasing rapidlySettling inDecliningCostsHigh R&D, unit and Falling rapidly, Declining production Stabilisinglaunch costsutilisation, scale and costs but higher experience effectsmarketing costs CompetitorsFewNew entrants, ConsolidationSome exitinnovator may sell outMarketing objectiveSuccessful introduction, Build market share by Retain customers, get Further reduce costs gain opinion leader focusing on new customers to switch, and exploit Product or endorsementcustomers and creating renewals and upgrades, branddistinct brand imageextend life cycle, increase frequency of use.
7 New Product uses, cost reductionProductBasic, little variety, Increasing variety and Stable, Declining variety, no quality not high, features, good quality standardisation, some further developmentfrequent design and reliabilitytinkering, eg, new changesimproved xyz PricesHigh, price-skimming Falling slowly, supply Falling rapidly, Stabilising, increasing strategy, introductory constraints may keep discounts, price in late decline stageoffersprices highcompetitionPromotionPromote Product , build Mass-market Focus on brand and its Scaled down brand awareness, user advertising, increased advantages, loyalty, promotioneducation, press focus of brandbundling, affinityrelations, high advertising to sales ratioPlaceSpecialist retailers, Mass-market channels, Mass-market channels, Phase out marginal dealers who can give large multipleslarge multiples, outlets, some multiples advice, exclusivity dealspower of channels may de-list, increasesspecialisationCash flowNegativeBreak evenPositivePositive, but decliningProfitabilityLossesProfitableMa rgins decline, but Declining margins offset by volumeoffset by low depreciation charges, possible write-downsRiskHigh business riskLow demand side risk, Low business risk, Low business risk.
8 But cash flow riskscyclical factor impactlabour conflict in unionised industriesIntroductionThe introduction stage is the period before sales start to increase exponentially. It is theriskiest stage and requires most management effort. The business will have alreadycommitted substantial resources. Despite convincing market research, the Product may failthe test of the real market. There is still the opportunity to fine-tune the marketing mix orProduct life cycle stage analysis67even relaunch the Product . If there are early signs of success and sufficient resources areavailable, managers may opt for penetration pricing, thereby driving up volume andcapturing market share before competitors enter the market. However, this increases riskand failure will be rapid acceleration of sales signals the start of the growth stage, which can be dividedinto the accelerating growth stage and the decelerating growth stage.
9 In the acceleratinggrowth stage, the incremental year-on-year sales increase. In the decelerating growth stage,sales are still growing but year-on-year incremental sales decline. The dividing pointbetween the two is the point of inflection in the s-shaped Product life cycle the business changes to become more volume driven, the risks profile for the Product is now proven and competitors enter the market. The expansionrequires investment in capacity and working capital. The early growth stage may coincidewith the highest funding requirement. Many businesses fail during the expansion stage,not because they are unprofitable but because they become insolvent. A strategy for asmaller entrepreneur may be to sell out to a larger, later entrant.
10 The rationale for seeking abuy-out is not just access to resources. The introduction stage and the growth stage requiredifferent kinds of organisation and skills. Indeed, many business plans have an explicit exitstrategy, seeking to sell out once the business is in the early growth stage. In the early growth stage the focus is usuallyon winning new customers. This stage iscrucial to positioning the Product as a market leader. In the late growth stage moreattention is given to customer retention. MaturityAt this stage the focus shifts to a fight for market share and cost reduction. Someconsolidation may take place. Because growth objectives remain, businesses may seek toincrease sales through a higher repeat sales rate, increased frequency of use or finding newuses for an existing Product .