Transcription of 9. The Weibull Distribution
1 Virtual Laboratories > 4. Special Distributions > 1 2 3 4 5 6 7 8 9 10 11 12 13 14 159. The Weibull DistributionIn this section, we will study a two-parameter family of distributions that has special importance in Basic Weibull Distribution 1. Show that the function given below is a probability density function for any k > 0:f (t) =k tk 1 exp( tk), t > 0 The Distribution with the density in Exercise 1 is known as the Weibull Distribution Distribution with shape parameterk, named in honor of Wallodi Weibull . Note that when k = 1, the Weibull Distribution reduces to the exponentialdistribution with parameter 1. 2. In the random variable experiment, select the Weibull Distribution . Vary the shape parameter and note the shape andlocation of the density function. For selected values of the shape parameter, run the simulation 1000 times with anupdate frequency of 10.
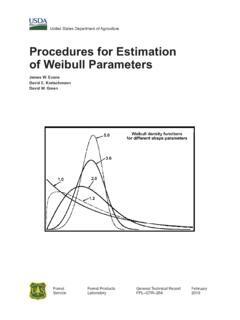
2 Note the apparent convergence of the empirical density to the true following exercise shows why k is called the shape parameter. 3. Graph the Weibull probability density function . In all cases, note that f (t) 0 as t . Moreover,If 0 <k < 1, f is decreasing with f (t) as t k = 1, f is decreasing with f (t) 1 as t 0. This special case corresponds to the exponential k > 1, f at first increases and then decreases, with a maximum value at the mode t =(k 1k)1 4. Show that the Distribution function isF(t) = 1 exp( tk), t > 0 5. Show that the quantile function isF 1(p)= ( ln(1 p))1 /k, 0 < p < 1 6. In the quantile applet, select the Weibull Distribution . Vary the shape parameter and note the shape and location ofthe density function and the Distribution function. 7. With k = 2, find the median and the first and third quartiles. Compute the interquartile range.
3 8. Show that the reliability function isG(t) = exp( tk), t > 0 9. Show that the failure rate function ish(t) =k tk 1, t > 0 10. Graph the failure rate function h, and relate the graph to that of the density function f . In particular show thath is decreasing if 0 <k < is constant if k = 1. This special case corresponds to the exponential is increasing if k > , the Weibull Distribution can be used to model devices with decreasing failure rate, constant failure rate, orincreasing failure rate. This versatility is one reason for the wide use of the Weibull Distribution in that X has the Weibull Distribution with shape parameter k. The moments of X, and hence the mean andvariance of X can be expressed in terms of the gamma function. 11. Show that (Xn) = (1+nk) for n > 0. Hint: In the integral for (Xn), use the substitution u =tk. Simplifyand recognize the integral as a gamma integral.
4 12. Use the result of the previous exercise to show that (X) = (1+1k) (X) = (1+2k) 2(1+1k)b. 13. In the random variable experiment, select the Weibull Distribution . Vary the shape parameter and note the size andlocation of the mean/standard deviation bar. For selected values of the shape parameter, run the simulation 1000 timeswith an update frequency of 10. Note the apparent convergence of the empirical moments to the true General Weibull DistributionThe Weibull Distribution is usually generalized by the inclusion of a scale parameter b > 0. Thus, if Z has the basicWeibull Distribution with shape parameter k, then X =b Z has the Weibull Distribution with shape parameter k andscale parameter of the results given above follow easily from basic properties of the scale transformation. 14. Show that the probability density function isf (t) =kbk tk 1 exp( (tb)k), t > 0 Note that when k = 1, the Weibull Distribution reduces to the exponential Distribution with scale parameter b.
5 The specialcase k = 2, is called the Rayleigh Distribution with scale parameter b, named after William Strutt, Lord that the inclusion of a scale parameter does not effect the basic shape of the density; thus the results in Exercise 3and Exercise 10 hold, with the following exception: 15. Show that when k > 1, the mode occurs at t =b (k 1k)1 /k. 16. In the random variable experiment, select the Weibull Distribution . Vary the parameters and note the shape andlocation of the density function. For selected values of the parameters, run the simulation 1000 times with an updatefrequency of 10. Note the apparent convergence of the empirical density to the true density. 17. Show that the Distribution functionF(t) = 1 exp( (tb)k), t > 0 18. Show that the quantile function isF 1(p)=b ( ln(1 p))1 /k, 0 < p < 1 19. Show that the reliability function isG(t) = exp( (tb)k), t > 0 20.
6 Show that the failure rate function ish(t) =k tk 1bk, t > 0 21. Show that (Xn) =bn (1+nk) 22. Show that (X) =b (1+1k) (X) =b2 ( (1+2k) 2(1+1k))b. 23. In the random variable experiment, select the Weibull Distribution . Vary the parameters and note the size andlocation of the mean/standard deviation bar. For selected values of the parameters, run the simulation 1000 times withan update frequency of 10. Note the apparent convergence of the empirical moments to the true moments. 24. The lifetime T of a device (in hours) has the Weibull Distribution with shape parameter k = and scaleparameter b = the probability that the device will last at least 1500 the mean and standard deviation of T . the failure rate is a simple one-to-one transformation between Weibull distributed variables and exponentially distributed variables. 25. Suppose that k > 0 and b > 0.
7 Show thatIf X has the standard exponential Distribution (parameter 1), then Y =b X1 /k has the Weibull Distribution withshape parameter k and scale parameter Y has the Weibull Distribution with shape parameter k and scale parameter b, then X =(Yb)k has the standardexponential following exercise is a restatement of the fact that b is a scale parameter. 26. Suppose that X has the Weibull Distribution with shape parameter k and scale parameter b. Show that if c > 0then c X has the Weibull Distribution with shape parameter k and scale parameter b c. 27. Suppose that (X, Y ) has the standard bivariate normal Distribution . Show that the polar coordinate distanceR = X2+Y2 has the Rayleigh Distribution with scale parameter 2 .Virtual Laboratories > 4. Special Distributions > 1 2 3 4 5 6 7 8 9 10 11 12 13 14 15 Contents | Applets | Data Sets | Biographies | External Resources | Keywords | Feedback |