Transcription of A basic introduction to fixedeffect and randomeffects ...
1 Research ArticleReceived 1 December 2009,Revised 19 August 2010,Accepted 25 August 2010 Published online in Wiley Online Library( ) DOI: basic introduction to fixed-effect andrandom-effects models for meta-analysisMichael Borensteina , Larry V. Hedgesb, Julian Higginscand Hannah R. RothsteindThere are two popular statistical models for meta-analysis, the fixed-effect model and the random-effects model. Thefact that these two models employ similar sets of formulas to compute statistics, and sometimes yield similar estimatesfor the various parameters, may lead people to believe that the models are interchangeable. In fact, though, the modelsrepresent fundamentally different assumptions about the data. The selection of the appropriate model is important toensure that the various statistics are estimated correctly. Additionally, and more fundamentally, the model serves toplace the analysis in context. It provides a framework for the goals of the analysis as well as for the interpretation ofthe this paper we explain the key assumptions of each model, and then outline the differences between the conclude with a discussion of factors to consider when choosing between the two models.
2 Copyright 2010 JohnWiley & Sons, :meta-analysis; fixed-effect; random-effects; statistical models; research synthesis; systematic reviewsIntroductionThere are two popular statistical models for meta-analysis, the fixed-effect model and the random-effects model. Under thefixed-effect model we assume that there is one true effect size that underlies all the studies in the analysis, and that all differencesin observed effects are due to sampling error. While we follow the practice of calling this a fixed-effect model, a more descriptiveterm would be a common-effect model. In either case, we use the singular (effect) since there is only one true contrast, under the random-effects model we allow the true effect sizes to differ it is possible that all studies share acommon effect size, but it is also possible that the effect size varies from study to study. For example, the effect size might behigher (or lower) in studies where the participants are older, or more educated, or healthier than in other studies, or when a moreintensive variant of an intervention is used.
3 Because studies will differ in the mixes of participants and in the implementationsof interventions, among other reasons, there may be different effect sizes underlying different studies. If it were possible toperform an infinite number of studies (based on the inclusion criteria for the review), the true effect sizes for these studieswould be distributed about some mean. In a random-effects meta-analysis model, the effect sizes in the studies that actuallywere performed are assumed to represent a random sample from a particular distribution of these effect sizes (hence the termrandom effects). Here, we use the plural (effects) since there is an array of true selection of the model is critically important. In addition to affecting the computations, the model helps to define thegoals of the analysis and the interpretation of the statistics. In this paper we explain the similarities and differences between themodels and discuss how to select an appropriate model for a given exampleFor illustrative purposes, we use fictional scenarios in which the goal is to estimate the mean score on a science aptitude example is a bit unusual, in that the effect size is a simple mean, whereas most meta-analyses employ an effect size thataBiostat, Inc.
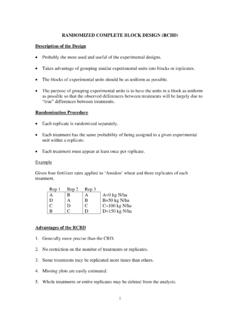
4 , Englewood, NJ, of Statistics, Northwestern University, Evanston, IL, Biostatistics Unit, Cambridge, Department, Baruch College City University of New York, NY, Correspondence to: Michael Borenstein, Biostat, Inc., Englewood, NJ, E-mail: 2010 John Wiley & Sons, Syn. ,1 97--11197M. BORENSTEINET 1. Example of a fixed-effect 2. Example of a random-effects the impact of an intervention or the strength of a relationship. However, the same procedures apply in all cases, andthe selected example will allow for a simpler presentation of the relevant exampleThe defining feature of the fixed-effect model is that all studies in the analysis share a common effect size. Suppose that wewant to estimate the mean aptitude score for freshmen at a specific college. Suppose further that the true mean at this collegeis 100, with a standard deviation of 20 points and a variance of 400. We generate a list of 1600 freshmen (selected at random)from that college. The testing facility cannot accommodate all these students at one sitting, and so we divide the names intofive groups, each of which is considered a separate study.
5 In studies A, B, D, and E, the sample size is 200, whereas in studyC the sample size is 800. If we assume that the assignment to one group or another has no impact on the score, then all fivestudies share a common (true) effect size, and the fixed-effect model analysis based on a fixed-effect model is shown in Figure 1. The effect size and confidence interval for each study appearon a separate row. The summary effect and its confidence interval are displayed at the exampleThe defining feature of the random-effects model is that there isa distributionof true effect sizes, and our goal is to estimate themean of this distribution. Suppose that we want to estimate the mean score for freshmen atanycollege in California. Supposefurther that the true mean across all of these colleges is 100 and that within any college the scores are distributed with a standarddeviation of 20 points and variance of 400. First, we select five colleges at random. Then, we sample students at random fromeach of these colleges, using a sample size of 200 for colleges A, B, D, and E, and of 800 for college C.
6 We will be using themean of these colleges to estimate the mean at all colleges. Since it is possible (indeed, likely) that the true mean differs fromcollege to college, the fixed-effect model no longer applies, and a random-effects model is more analysis based on a random-effects model is shown in Figure 2. The effect size and confidence interval for each studyappear on a separate row. The summary effect and its confidence interval are displayed at the that we have deliberately (if somewhat artificially) used the same data for the fixed-effect and random-effects models tohighlight how the underlying model affects the results. The following differences are apparent. First, the confidence interval for thesummary effect is wider under the random-effects model. Second, the study weights are more similar under the random-effectsmodel (large studies lose influence while small studies gain influence). For example, compare the size of the boxes for the largestudy (C) vs a small study (B) under the two models.
7 Third, the estimate of the effect size differs under the two two analyses sometimes produce exactly the same results, but often their results will differ. When this happens, eithermodel can yield the higher estimate of the effect size. Furthermore, under the random-effects model the confidence interval will98 Copyright 2010 John Wiley & Sons, Syn. ,1 97--111M. BORENSTEINET 3. Schematic of the fixed-effect be wider and the weights will always be more similar to each other than under the fixed-effect model. The reason forthese different results will become clear as we explore the differences between the two the combined effectSources of variance in meta-analysisWe use the termvariancein five ways, to refer to (a) the square of the standard deviation of scores in the population (thepopulation variance), (b) the square of the standard deviation of true effects across studies (thebetween-studies variance), (c) thesquare of the standard error of estimation within a study (thewithin-study error variance), (d) the square of the standard error ofestimation in the context of the meta-analysis model (theoverall study error variance) and (e) the square of the standard error ofestimation of the combined result (themeta-analysis error variance).
8 Note that (a) and (b) are properties only of the distributionsof scores within and across populations, and as such do not depend on the sample size. By contrast, (c), (d) and (e) depend alsoon the sizes of the samples, and to clarify this we refer to them all as error majority of meta-analyses assign weights to each study based on the inverse of the overall study error variance (thatis, 1/variance), and that is the approach we shall pursue in this paper. This provides a generic approach to meta-analysis thatcan be used to combine estimates of a large variety of metrics, including standardized mean differences, means differences,correlation coefficients, regression coefficients, odds ratios and simple means or proportions. Studies with a precise estimate ofthe population effect size (a low variance) are assigned more weight, while studies with a less precise estimate of the populationeffect size (a high variance) are assigned less scheme is used for both the fixed-effect and random-effects models.
9 Where the models differ is in what we mean by aprecise estimate, or (more correctly) how we define the overall study error variance. As outlined above, under the fixed-effectmodel there is one level of sampling (we sample subjects within the college), and therefore one source of variance. By contrast,under the random-effects model there are two levels of sampling (we sample colleges from the population of colleges and thenstudents within each college), and therefore two sources of fixed-effect model is depicted in Figure 3. All studies share a common (true) effect size, which is a score of 100. This meanis represented by the symbol (theta) at the bottom of the figure shows two studies drawn from this population. For each study, thetruescore is represented by a filled circle. Thecircle for each study falls at the common (100), since all studies are assumed to share the same effect size. Theobservedmeanfor each study is represented by a filled square, which differs from the true mean because of estimation observed mean for any studyiis given byYi= + i,(1)where iis the difference between the common true mean and the observed mean for studyi.
10 It follows that there is onlyone source of variation, the estimation error i. In a fixed-effect meta-analysis, the overall study error variance is equal to thiswithin-study error each study, we have superimposed a normal curve on the true score. This curve is based on the within-study error varianceand shows the range within which the observed mean score is likely to fall. This variance is given byVi= 2n.(2)In words, the error variance of a sample mean depends on two factors. One is the variance of the individual observations in thepopulation ( 2) the sample means will be more precise if the scores are clustered in a narrow range. The other is the size ofthe sample (n) a larger sample yields a more precise estimate of the population 2010 John Wiley & Sons, Syn. ,1 97--11199M. BORENSTEINET 4. Schematic of the random-effects population variance for both studies is assumed to be 400. For Study 1 the sample size is 200, which yields a within-studyerror variance of and standard error of For Study 2 the sample size is 800, which yields an error variance of andstandard error of With an infinitely large sample size, the width of the normal curve will approach zero and the observedmean for the study will approach the true mean for that study (which is also the common mean).