Transcription of A Brief History of Control Valve Noise Prediction - …
1 MATERIALS REFERENCE ISSUE 13A Brief History ofControl Valve Noise PredictionThe development of a physics based Prediction model for the Noise generated by Control valves is reviewed. The History covers a 40 year period of experimentation and development through an industry wide cooperation via standards committees in the United States and Internationally. The History illustrates the multi-year time frame associated with the development of industrial stan-dards for complex processes. The process involved manufacturers and users with their separate interests but with a common goal of a good Noise Prediction standard. A Brief description of the Noise Prediction model is Noise can be generated by Control valves , particularly in the power industry during the startup and shutdown of these complex boiler-turbine systems.
2 Control valves are used to Control flow and pressure of a fluid to maintain a desired output. They are also critical Control elements for bypassing various heat exchang-ers and the turbine during thermal transients. This requires high-pressure letdown. Pressure reductions as high as 25 MPa (3600 psi) to a vacuum in the condenser are required. Hot water flashes and cavitates while steam jets will whistle and screech, causing Noise levels to exceed 115 Occupational Safety and Health Administration drafted Noise exposure rules in the 1970s and finalized the rules in For example, a worker could not work more than eight hours in an environment where Noise levels exceeded 90 dBA, and a company was required to initiate Noise Control administrative procedures if the Noise exceeded 85 dBA. This created a need for Control Valve manufacturers to provide Noise estimates for their designs to comply with engineering specifications that limited the Noise level in a given manufacturers scrambled with many Noise tests and limited theory to develop Prediction models for their products.
3 The bulk of the theory was based on Lighthill s paper2 dealing with Noise created by freely expanding jets. However, the Noise created by a Control Valve propagates into the confined downstream piping, which causes the development of a very complex acoustic field. The high-pressure metal piping can have wall thicknesses that vary from 6-100 mm (1/4 inch to 4 inches) or more. Pipe diameters are usually less than 600 mm (24 inches) but can exceed this size significantly for some early Prediction models were mostly empirical, using vari-ables that influenced Noise such as pressure drop across the valves , flow rates and fluid properties. The models were very limited and applicable to the designs that were tested. The ISA Handbook of Control Valves3 published early versions of these empirical models in 1976.
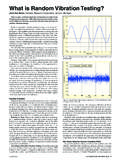
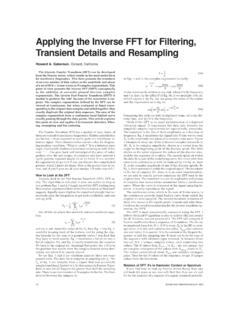
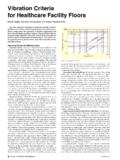
4 The handbook used input from four different contribu-tors, which was a reflection of the amount of new investigations and development that had taken place and to present a balanced picture of this involved subject. With each Control Valve manufacturer having its own Noise Prediction model, it was quite frustrating for plant designers and Valve users to arrive at consistent predictions of the Noise levels. Additionally, there were more than 40 different Valve manufactur-ers capable of supplying valves to a given plant, which resulted in a lot of uncertainty and varied results for what were expected to be similar Valve uncertainty was illustrated by a study comparing the Prediction of Noise for valves with the same sizing conditions as illustrated in Figure The varying flow and inlet pressure were typical of valves handling steam in the power the manufacturers became more enlightened about the im-pact of the Noise created by the jets exiting the Valve Trim during the pressure letdown process, there was a motivation to develop other designs.
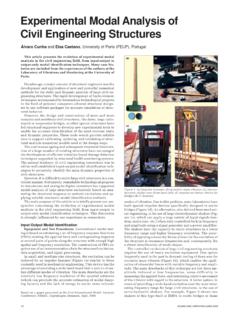
5 (The part called Trim refers to the internal part of the Valve that causes the fluid pressure drop.) These designs focused on reducing the fluid jet energy exiting the Valve Trim by either splitting the jets into smaller components and/or reducing the velocity of the jets by forcing the flow through more tortuous pressure letdown of the earliest versions of Valve Trim that used this concept of fluid jet energy Control was patented in 19705 and is illustrated in Figure 2. The flow pattern consists of multiple flow paths. Within each flow path, there are multiple right-angle turns, as flow is forced up and down through punched holes in adjacent disks. Each turn causes a pressure drop, and by adding enough turns, a Herbert L. Miller, Consultant , Laguna Hills, CaliforniaFigure 1. Comparison of different manufacturers Noise Prediction methods (1983): a) Sound pressure level of steam at constant mini-mum pressure drop at temperature conditions; b) Sound pressure level Prediction of steam at constant flow of 215 SOUND & VIBRATION/JULY 2017lower velocity jet exiting the trim can be flow in Figure 2 is directed toward the outside diameter of the trim.
6 However, this could be designed to have flow from the outside to the center of the trim if needed. To achieve the desired flow through the Valve , an appropriate number of disk sets are stacked on top of each other. The flow is then controlled by a Valve plug moving up or down through the center, exposing or hiding flow paths. There have been many variations to this approach throughout the to the uncertainty associated with various Valve manufactur-ers Noise predictions, the ISA Control Valve Standards Committee arranged a research project in 1974. (The Instrument Society of America is now the International Society of Automation; Research Triangle, NC).The project s objective was to provide Control Valve users with a single Noise Prediction method that was based on theoretical fundamentals of the physical process.
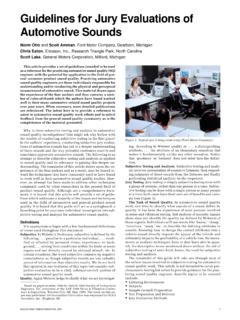
7 Multiple Control Valve manufacturers contributed to the research that was conducted by Pennsylvania State The research included testing of a simple Valve design (see Figure 3) so that the methodology could be supported with as few empirical factors as possible. The key factors that were established were acoustical efficiency and the amount of Noise generated that exited the Valve into the downstream piping. Acoustical efficiency was on the order of percent of the total jet kinetic energy, and only one-fourth of the total Noise generated was typically propagating into the downstream resulting theoretical model for the Valve tested consisted of four parts: Calculating total jet kinetic energy exiting the Valve pressure reducing trim. Estimating the amount of this energy that was converted to acoustical energy.
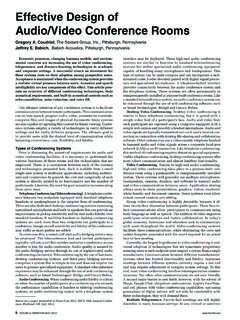
8 Determining the amount of acoustical energy that was transmit-ted through the downstream pipe wall. Noise radiated from the bulky Valve body was considered negligible. Calculating how much of the Noise transmitting through the pipe was radiated to a listener one meter downstream of the Valve and one meter off the pipe surface. Results would be adjusted using the A-weighting scale to reflect the Noise an average person would most complex feature of the model was the transmission loss through the downstream pipe wall. Each pipe size has differ-ent values and numbers of coincident frequencies impacting the transmission. For example, a 2-inch Schedule 80 pipe, mm ( inch) wall thickness, has six coincident frequencies; an 8-inch Schedule 40 pipe, mm ( inch) thickness, has 68 co-incident frequencies.
9 A typical pipe response is shown in Figure of the theoretical model were first published by Bau-mann in The Pennsylvania University results were pub-lished by Reethof in The model was used in a draft standard for Aerodynamic Noise Prediction by ISA in 1982 and circulated for preliminary use and critique. The standard included tables of pipe transmission loss in one-third octaves from 25 to 20,000 Hz for pipe sizes from 1 to 24 inches of three different pipe wall thicknesses for each pipe size and for pipe fluid Mach numbers of zero and Predicting the Noise required the user to make numerous interpolations and sum the Noise for each of the octave bands. Accuracy for most valves was estimated to be within 5 dBA. The valves considered in the model had a single pressure drop trim like that shown in Figure 3.
10 The standard was not applicable to multi-path, multi-stage type trim like that shown in Figure ISA Prediction standard caused a lot of confusion because of its complexity and difficulty in carrying out the laborious calculations. This was a period before the personal computer, so most users had to program this procedure on a large mainframe with limited availability because of other computing demands. As a result, the ISA committee made some simplifications by creating five separate jet Mach number regimes and providing the complex pipe transmission loss functions in a number of representative formulations. The first approved standard was published in 1989, seven years after the first this new Noise Prediction model, the users could calculate an expected Noise level, which was frequently different from what the Control Valve manufacturers would state.