Transcription of A Complete Solution for Method Linearity in HPLC and UHPLC
1 A Complete Solution for Method Linearity in HPLC and UHPLCF rank Steiner, Fraser McLeod, Tobias Fehrenbach, and Andreas Brunner Dionex Corporation, Germering, GermanyNow sold under the Thermo Scientific brandIntroductIonValidation for Linearity requires the preparation and analysis of a set of several independently prepared solutions. As an example, according to ICH guidelines, HPLC Method Linearity is normally based on five concentration levels between 70% and 130% of the nominal concentration, each to be injected three times. The laboratory effort for this process can be substantial, especially if the Method is required to quantify several substances simultaneously. To save time, it is common to prepare only one stock Solution and subsequently dilute it to the different concentration levels.
2 This procedure means that any error in the stock Solution preparation is carried through all subsequent dilutions. In addition, it means that the preparation of the standards differs from the process used in day-to-day operation of the Method , thus making comparison of the two processes study presents a fully automated gravimetric Solution to prepare all solutions for a calibration or Linearity test independently and without error-prone manual interference. All solutions prepared are immediately ready for injection onto the UHPLC analysis system. A comprehensive software package establishes the sequence for Linearity validation automatically. When the HPLC results are available, Linearity according to ICH guidelines is instantaneously calculated by the software, and all results are assessed against specification requirements.
3 This Complete Solution accelerates the process significantly, excludes typical operator errors that occur during manual sample preparation and result calculation, and produces results of full statistical Instrumental ConfigurationUltiMate 3000 Basic Automated System supporting pressures up to 620 bar at flow rates up to 10 mL/min, consisting of the modules listed in Table 1. HPLC Module Configuration and Connection TubingPumpLPG-3400SD with 200 L SpinFlow mixer kitSampler Column CompartmentACC-3000 DetectorDAD-3000 with semi-analytical flow cell ( L)CapillariesPump Sampler450 mm Viper CapillarySampler Column550 mm Viper CapillaryColumn Detector450 mm Viper Capillary2 Optimization of the Separation Power of 1-D Nano LC Analysis of Proteomics Samples A Complete Solution for Method Linearity in HPLC and UHPLCUHPLC Method ParametersThe UHPLC Method for analysis of soft drink ingredients used a core shell (fused core)-based m stationary phase material from Phenomenex.
4 Detailed Method parameters are listed in Table 2. UHPLC Column and Method Parameters for Soft Drink AnalysisColumnPhenomenex Kinetex 150 mm, m, C18 PrecolumnPhenomenex KrudKatcher , mInjection Volume20 L Full-loop injectionTemperature45 CMaximum Pres-sure515 barData Collection Rate/Rise Time50 sEluent formic acid (pH )Eluent BCH3 formic min7% min26% min50% min50% min7% min7% BInstrument Control and Data HandlingThe UltiMate 3000 system was controlled by chromeleon Chromatography Data System (CDS) software, version The fully automated sequence generation, data processing, and validation report generation is based on the chromeleon Extension Pack PreparationAll standards for the Linearity test of the soft drink analysis Method were prepared using automation to the final concentration, without further dilution steps.
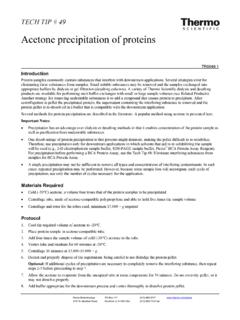
5 Solid dosing was performed with the Quantos QB1-L system (Mettler-Toledo, Greifensee, Switzerland) using QH075-B dosing heads (Figure 1). The stacked dosing of all five compounds (acesulfame K, saccharin, caffeine, vanillin, and benzoate) was performed directly into a 100 mL flask. Dosing of the methanol/water 1:1 sample solvent was also performed gravimetrically with the Quantos QB liquid dosing option (Figure 1). After dosing, vials were closed with slotted septa. The samples were then dissolved and homogenized by manual shaking before the vials were placed into the autosampler 1. Quantos QB1-L system for automated solid dosing and gravimetrically controlled liquid and dIscussIonPreparation of Samples for Linearity Validation Statistically, it is recommended that each concentration level for a Linearity test be individually prepared.
6 This has the effect of randomizing potential sources of error ( , a possible incorrect weighing for one of the standards). This is a time consuming process, however, so many laboratories prepare a stock Solution and then dilute it to the different concentration levels. The advantage of this approach is that it is a fast way of preparing standards, but the major disadvantage is that any error in the stock Solution will be carried through to the diluted standards. A better approach is to automate preparation of the standards. This can be achieved using the new Quantos QB1-L system from Mettler-Toledo. The system can automatically dispense and weigh analytes into HPLC vials or volumetric flasks. It can also weigh in the appropriate amount of diluents in order to provide a gravimetric experiment tested the Linearity of five analytes in a soft drink analysis.
7 The Quantos system automatically weighed the correct amount of each analyte, then the correct amount of diluent to provide the concentrations shown in Table 3. The time required to prepare these standards was only 50 min. A manual preparation based on the stock Solution approach would take approximately 2 h, or 4 h for the and manual individual preparation of all concentration levels, would require approximately 4 h. 3 Table 3. Concentrations (mg/100 g) of Soft Drink Analytes Prepared by Quantos QB1-LAnalyteStandard 1 Standard 2 Standard 3 Standard 4 Standard 5 Acesulfame the Analysis MethodUsing classic HPLC, a single soft drink analysis may take approximately 30 min.
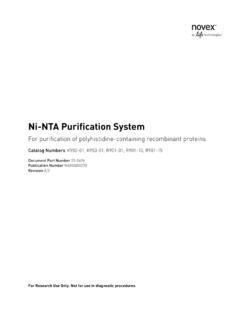
8 This means that the total run time for the Linearity experiment will be h (5 calibration levels 3 injections per level 30 min). With UHPLC , however, it is possible to signficantly decrease run time. Figure 2 shows the analysis of all five analytes, with all peaks separated in less than 4 min. This means that all injections can be performed in just h. The sequence generation with three injections at five different concentration levels is performed automatically by the chromatography data system, thus reducing labor 2. UHPLC analysis of five soft drink ingredients in less than 5 Analysis and Reporting of the Method Linearity ValidationOnce all data has been acquired, it is necessary to calculate the results.
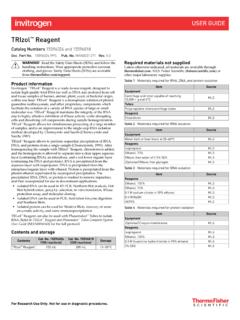
9 In keeping with ICH guidelines, the following values must be reported: correlation coefficient, y-intercept, slope of the regression line, and residual sum of squares. Laboratories must also confirm that the correlation coefficient is within the limits expected of the Method (typically ). Performing these calculations can be a time consuming task. Some laboratories use Excel spreadsheets in an effort to speed the process, but even this can be inefficient because users typically manually transcribe values into the spreadsheet, then have another person review the transcription. For this particular analysis, the estimated time for the use of spreadsheets and the associated review step is 2 h. KSaccharinCaffeineVanillinBenzoate4 Optimization of the Separation Power of 1-D Nano LC Analysis of Proteomics Samples A Complete Solution for Method Linearity in HPLC and UHPLCThe chromeleon CDS software immediately generates results for all analytes and creates the Complete report automatically.
10 All that is required by the operator is to name the peaks and enter their concentrations a process that takes just 5 min. Figure 3 shows the automatically generated report for the analyte combination of the Quantos QB1-L and the Dionex UltiMate 3000 system produced outstanding results for the Linearity experiment. Table 4 shows the correlation coefficient for all analytes, each of which has an R2 value > 4. Correlation Coefficients of All Analytes AnalyteR2 Acesulfame Time with Transfer to New Process As Table 5 shows, the time to perform the experiment using the traditional process is h. This process involves manual sample preparation with individual weighing, HPLC analysis at conventional speed, manual data processing, and report creation.