Transcription of A focus on Nigeria - EY - United States
1 Africa by numbers A focus on Nigeria Special report issued for: World Economic Forum on Africa 2014. Introduction 1 | Africa by numbers A focus on Nigeria Over the past 3 years, EY's Africa either of these extremes and in many the economy has consistently registered attractiveness reports have highlighted the respects depends on the perspective that high single digit growth rates. The recent continent's steady rise. Our research, which one chooses to adopt. Nevertheless, we rebasing of Nigeria 's GDP now makes it the includes both investor surveys and analysis certainly believe that the facts support the largest economy in Africa, and one of the of greenfield and brownfield FDI trends, more positive perspective on Nigeria and its 30 largest economies in the world. Nigeria 's has helped to provide some quantitative prospects as an investment destination. economic performance is still somewhat substance to the growing perception that dependent on oil, and remains susceptible The numbers tell us that Greenfield FDI.
2 African markets offer an exciting growth to changes in the oil price. However, as the projects into Nigeria have grown at a and investment opportunity. What our FDI trends indicate, it is the non-oil sector compound rate of close to 20% since 2007, research has also highlighted, however, is that has been the main driver of growth in positioning it among the 10 countries with a lingering perception gap between those recent years, led by agriculture, services, the highest growth rates in Africa. Nigeria companies already doing business on and wholesale and retail trade. has also attracted the most FDI capital and the continent and those with no business the 2nd most FDI projects in Sub-Saharan However, like most emerging markets, presence. Africa over that period, making it one of Nigeria will continue to face its fair share We have recently completed our 4th annual the star performers in a period in which FDI of challenges. Corruption, threats to survey, and the perception gap continues flows into the region have been fairly robust.
3 Physical security and poor infrastructure to persist those respondents with an are among those often cited as constraints What is equally positive is the increasingly established business presence in Africa to investment and doing business. Arguably diversified nature of the investment. are more positive than ever about the though, power shortages have been the Although more than 50% of the FDI capital continent's prospects, and, for the first biggest constraint to expanding investment invested into Nigeria since 2007 has been time, have also ranked Africa as the most and doing business. Nigeria has one of the into the capital intensive resource sectors attractive regional investment destination lowest per capita national power supplies (primarily oil), nearly 50% of FDI projects in the world today. In stark contrast, in the world, and most businesses rely are service-orientated. There has been respondents that have not yet invested on fuel-powered generators for reliable particularly strong growth in investment remain negative, rank Africa as the least power.
4 Besides the cost this adds to doing into telecommunications, with the sector attractive regional investment destination business (estimated to be as much as attracting of FDI projects between in the world. 40% in some sectors), it also significantly 2007 and 2013. Growth in investment into hampers broader industrial development. The reality other service sectors like financial services, Recent progress made in the privatisation In many respects, Nigeria epitomises consumer products, tourism and business of the power sector should significantly this almost bi-polar view of Africa: for services, further highlights the growing increase levels of investment into electricity many of us already doing business on the opportunities emerging in these sectors. generation and distribution, and could continent it is an exciting, dynamic, high A key driver of growing levels of investment transform the business environment in octane growth market; for some others, has been Nigeria 's robust and sustained Nigeria .
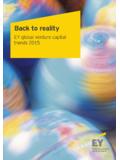
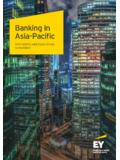
5 Often on the outside looking in, it seems economic growth. Over the past decade, chaotic, unstable, and uncertain. The reality is obviously less cut and dried than Nigeria has also attracted the most FDI capital and the 2nd most FDI. projects in Sub-Saharan Africa Africa by numbers A focus on Nigeria | 2. A robust economy Despite these challenges, and while many The privatisation of the power other emerging markets are suffering from the consequences of global monetary sector should significantly tightening, the Nigerian economy has remained remarkably robust. EY recently increase levels of investment developed a heatmap to illustrate the economic vulnerability of a group of 25. into electricity generation different emerging markets, drawing on previously published research into and distribution, and could currency and banking crises, and ranking each country under seven indicators of transform the business risk (current account balance, government debt, inflation, currency volatility, etc.)
6 Environment in Nigeria . According to these indicators, Nigeria has the 3rd highest overall ranking among all these emerging markets (and is also well ahead of the aggregate ranking for the US, Japan and Germany). This strong macro- economic management coupled with progress in the political domain, provides us with confidence that overall growth rates will continue in the 5-6% zone for the foreseeable future. Given these continued growth rates and the recent GDP rebasing, an improving business environment, a portfolio of active infrastructure projects with a value close to $100b, and, of course, a population of about 170m people, Nigeria 's billing as a powerhouse in a dynamic, high growth region is certainly justified. As a result, we anticipate that Nigeria will continue to be a key hub for investment into Africa, and is likely to emerge as one of the most attractive developing market investment destinations in the world in coming years.
7 3 | Africa by numbers A focus on Nigeria Economic vulnerability heatmap Currency Current Government Growth in Overall score External debt Inflation Import cover change over account debt credit to GDP. year Turkey 20 26 19 13 21 26 16 21. Argentina 19 14 16 14 24 24 17 24. Ghana 19 25 13 20 26 10 22 16. Vietnam 18 13 22 18 18 23 25 8. India 17 22 6 19 25 17 13 20. Egypt 16 19 5 23 23 5 23 18. Czech Republic 16 20 21 15 6 18 21 10. Brazil 15 17 4 22 17 25 3 19. Poland 15 23 24 21 5 16 15 1. Indonesia 15 12 9 7 20 21 11 23. South Africa 14 18 11 12 15 1 20 22. Advanced* 14 10 26 24 3 6 14 15. Ukraine 13 24 25 10 1 3 24 4. Colombia 13 21 8 9 9 20 9 14. Mexico 13 15 7 11 14 19 18 6. Chile 12 16 18 2 7 13 12 17. Thailand 11 11 12 8 10 22 7 11. Kazakhstan 11 5 23 4 16 4 19 9. Malaysia 11 4 15 17 8 15 8 12. Russia 10 6 14 3 19 12 4 13. Korea 9 8 17 16 4 7 10 3. UAE 8 3 10 1 2 8 26 4. Qatar 8 1 20 1 12 11 5 4. Nigeria 7 7 1 6 22 2 6 7. China 6 9 2 5 11 14 2 2.
8 Saudi Arabia 5 2 3 1 13 9 1 5. *Aggregate measure of Germany, Japan and the US. What is displayed in each column 7. Import cover shows the ratio of foreign exchange reserves to imports in 1. Overall scores are based on the addition of the seven rankings. We have 2013. then normalised the total rankings from 1 to 20. The highest figure 8. Currency change over year shows the change in the currency against indicates the highest risk. the US Dollar over the 12 months to mid-December 2013. 2. Current account balance shows the strength of the current account balance in 2013. Legend of colours used in first column (overall score). 3. External debt shows the level of external debt over GDP in 2012. 4. Government debt shows the level of government debt over GDP in For each indicator, we have marked: 2012. In red: the eight countries with the highest risk 5. Inflation shows average inflation in 2013. In orange: the nine ountries with medium risk 6.
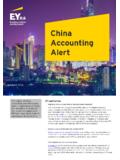
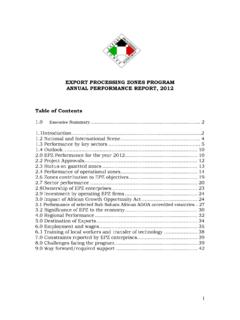
9 Growth in credit market shows the average growth of credit markets as In green: the nine countries with the lowest risk a share of GDP fro 2010 to 2012. Africa by numbers A focus on Nigeria | 4. Tunisia co Nigeria oc or M. Algeria Western Libya Egypt Sahara Cape Verde Mauritania Mali Niger Chad Sudan Eritrea Senegal Burkina Faso Gambia Djibouti Nigeria Ghana Guinea South Ethiopia Bissau Benin Central African Sudan Republic Guinea Togo Cameroon Uganda Somalia Equatorial Guinea Democratic Kenya Sierra Leone Republic of Liberia Sao Tome Congo Rwanda Seychelles C te d'Ivoire Gabon Congo Burundi Tanzania Comoros Angola Zambia Malawi Abuja Mauritius car Ibadan Zimbabwe agas Namibia Lagos Botswana Mad Port Harcourt Reunion Mozambique Swaziland Country overview South Africa Lesotho Opportunity indicators Risk indicators Ease of doing business overall rank out of 184. GDP (current)* US$ 131. countries (17th in Africa). Transparency International Corruption Perceptions Population growth (annual) Index (0=highly corrupt, 100=very clean; ranked 38th 27.)
10 In Africa). Strength of investor protection index (0 =unfavorable, Population (m) 10=favorable; ranked 12th in Africa). Mobile penetration (% of population with mobile Logistics Performance Index: overall rank out of 155. % 121. access) countries (25th in Africa). Urban population (% of total) % Democracy score (0=lowest, 10=highest) 4. Real GDP growth (compound average growth rate): Mo Ibrahim Index of African Governance (rank out of % 43. 5-year forecast (2018) 52 countries). Real GDP growth (compound average growth rate): Perceptions of governance rule of law: percentile % 10-year historical (2003) rank (0=lowest, 100=highest). Perceptions of governance regulatory quality: GDP per capita (US$): 5-year forecast (2018) US$2,652 20. percentile rank (0=lowest, 100=highest). Country wealth (1=low income, 2=lower middle, Quality of overall infrastructure (1=extremely 3=upper middle, 4=high income (non-OECD), 5=high 2 underdeveloped, 7=extensive and efficient by income (OECD)) international standards).