Transcription of A Gentle Introduction to the Calculus of Sustainable ...
1 Reprinted with permission from the Society of FSP. Reproduction prohibited without publisher's written permission. A Gentle Introduction to the Calculus of Sustainable income : What Is Your Retirement RisQuotient? by Moshe A. Milevsky, PhD. Introduction and Motivation: Abstract: A little over a year ago, on january 1, 2006, Boomer Wants income the first American baby boomer turned 60. These birth- he last few years have seen intense research days are expected to continue at the rate of one per 7- 10 seconds over the next 20 years. In anticipation of this T around the topic of retirement income plan- ning. One of the most widely studied issues is demographic wave the financial services industry is how to build a portfolio that will provide a Sustainable bracing for the retirement income revolution, and one income flow over the uncertain length and cost of the of the critical issues is how to build a portfolio that will provide a Sustainable income flow over the uncertain human lifecycle.
2 Not surprisingly, a number of recent length and cost of the human lifecycle. Indeed, a num- articles have argued that one of the key components to a ber of recent articles have gained notoriety by advocat- Sustainable retirement is to simply avoid spending too ing spending rates in the 4-6% vicinity as being sustain- much. A variety of authors have advocated spending rates able for portfolios that contain 70-90% equity exposure. in the 4-6% vicinity as being Sustainable for portfolios that But prudent risk management involves more contain 70% to 90% equity exposure. To be clear, a spend- than just controlled consumption, and this article ing rate of x percent is meant to imply withdrawing $x per deliberately avoids advocating a particular spending original $100 nest egg on an annual basis, with each year's rate.
3 Instead it provides an overview of the analytic relationship or Calculus among the three key risk vari- spending being adjusted for consumer price ables that determine income sustainability. These are For example, Bengen; Ho, Milevsky, and Robinson;. brought together by linking investment characteris- Cooley, Hubbard, and Walz; Pye; Milevsky; Ameriks, tics, spending rates, and longevity risk, to provide Veres, and Warshawsky; and Guyton have all created what is coined the Retirement And, financial experiments incorporating historical, simulated, while statistical formulas will never capture the com- and scrambled returns to quantify the sustainability of plex nuances of retirement reality, there are a variety various ad hoc spending policies and consumption rates of intuitive insights that can be gleaned from this for retired As a number of financial com- summary number.
4 Moreover, this Calculus illustrates mentators have emphasized, the problem with such stud- how products with longevity insurance ( , life annu- ities) and downside protection ( , embedded put ies is that (1) these simulations are often difficult to options) can increase the sustainability by reducing replicate by financial practitioners, (2) many conduct the Retirement RisQuotient. only a minimal number of simulations, and (3) most provide little pedagogical intuition on the financial trade- off between retirement risk and return. More impor- This issue of the Journal went to press in June 2007. tantly, they focus too much attention on the relationship Copyright 2007, Society of Financial Service Professionals. between spending habits and the composition of the investment portfolio, yet they neglect the many other JOURNAL OF FINANCIAL SERVICE PROFESSIONALS / JULY 2007.
5 51. A Gentle Introduction to the Calculus of Sustainable income : What Is Your Retirement RisQuotient? factors that determine retirement income sustainability. ability is presented first. Although the underlying mathe- For example, important questions such as: What are the matics are quite complicated and are described elsewhere, roles of variable payout (or income ) annuities and their the main formula itself can be implemented using a func- guaranteed riders in a Sustainable portfolio? are not tion that is easily available in Microsoft Excel. Next, a addressed in any of these studies. short-cut method for arriving at the Retirement RisQuo- Therefore, to differentiate this article from the recent tient using two summary variables is provided. Some simulation-based debate around prudent retirement caveats and warnings about the underlying assumptions spending, this article will deliberately avoid advocating a are discussed, and then illustrations show how this risk preferred portfolio withdrawal rate.
6 Instead, it provides measurement system can be extended to include life annu- an overview of the analytical relationship between the key ities and various downside protected portfolio strategies, risk variables that determine sustainability. These ingre- many of which are embedded within variable annuities. dients are brought together by linking portfolio param- eters, spending rates, and longevity risk to an analytic The Main Formula: probability of retirement ruin. More specifically, a num- Probability of Retirement Ruin ber of key variables are identified that will determine a If a retiree is invested in a standard (balanced) port- retiree's Retirement RisQuotient. folio and plans on withdrawing a fixed inflation-adjusted While statistical formulas will never capture the amount every year during retirement, he or she obviously complex nuances of retirement reality, there are a variety faces the probability that his or her portfolio will be of intuitive insights that can be gleaned from this sum- exhausted while still alive.
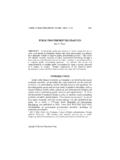
7 Whether or not these constant mary Retirement RisQuotient metric. Moreover, this static withdrawals are a realistic assumption for the Calculus helps illustrate how products with longevity behavior of actual retirees, the underlying paradigm is the insurance ( , life annuities) and downside protection foundation of numerous simulation-based studies. Fig- ( , the put options embedded within variable annu- ure 1 provides a graphical illustration. Nevertheless, ities) can increase the sustainability of retirement. under basic portfolio-dynamic assumptions, the formula The remainder of this article is organized as follows. for this probability of retirement ruin the probability The basic formula that helps us estimate ruin and sustain- that a fixed spending plan will deplete a retirement nest egg prior to the end of the lifecycle can be expressed in two distinct steps.
8 First, define: FIGURE 1. 2( + 2 ) 2 + . Will the nest egg be enough = 1, = 1. 2 + 2. to fund the income gap ? where denotes the retiree's portfolio expected rate of return, denotes the volatility or uncertainty surrounding Retirement income Needs this projected investment return, denotes the mortality Retirement rate of the retiree, and S denotes the inflation-adjusted Nest Egg pensions, annuity ? spending rate as a percentage of the initial portfolio value. income & other income longevity insurance Gap The probability of retirement ruin 1 minus the probability of sustainability can be obtained via the GammaDist formula in Excel: The formula described computes the probability that a given retirement nest egg will be sufficient to finance RetirementRuin = GammaDist (S/ , , 1, TRUE) 2.
9 The income gap, which is the difference between retirement income needs and pension-like benefits. where the two intermediary variables ( , ) are defined by equation 1 as explicit functions of the four input variables JOURNAL OF FINANCIAL SERVICE PROFESSIONALS / JULY 2007. 52. A Gentle Introduction to the Calculus of Sustainable income : What Is Your Retirement RisQuotient? ( , , , S), all of which will be explained in greater According to mortality tables used by pension actu- detail in a moment. Note that the last expression in the aries, this typically healthy 65-year-old client has formula (TRUE) is meant to indicate to Excel that the (approximately) a 94% chance of surviving for 5 more user is interested in the cumulative distribution function years to age 70, a 56% chance of surviving for 20 more (CDF) and not the probability mass function (PMF).
10 Years to age 85, and a 16% chance of surviving for 30. First, let's break equation 1 into bite-sized pieces more years to age 95. Client retirement horizons are and translate the Greek into English. The formula random and they obviously face the longevity risk of out- depends on four input variables ( , , , S) that get living their nest eggs if they live longer than anticipated. mapped into the two intermediate variables ( , ), It is hard to overstate the importance of incorporating which then get used in the actual formula. longevity risk when preparing a retirement plan. The One can think of the underlying problem in the many research studies (and software algorithms) that following way. At retirement the individual has a sum of focus deterministically on 20, 25, or 30 years of retire- money (nest egg) that must finance a fixed consumption ment are ignoring the most vexing risk of them all.