Transcription of A Guide to High Resolution Melting (HRM) Analysis
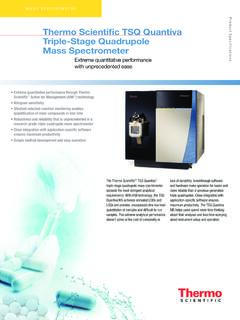
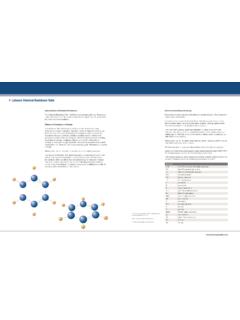
1 (C)0-5-1051015202530 Heterozygote Hom - wild type Hom - variantA Guide to High Resolution Melting (HRM) Introduction About HRM Analysis .. Fundamentals of Fluorescent DNA Melting Analysis .. HRM Analysis .. The HRM Analysis Workflow ..72. HRM Assay and Reagent Optimization DNA Quality .. Amplicon Length .. Primer Selection .. Dye Selection .. HRM PCR Reagents .. Instruments and Software ..16 3. Troubleshooting Your HRM Experiment 184. Summary 19 5. Applications Appendix 20 6. References 20A Guide to High Resolution Melting (HRM) AnalysisTable of ContentsInformationalAmplicon Length and SNP Detection ..10 Human Single Nucleotide Polymorphism (SNP) Occurrence and Tm ..11 SYBR Green Dye Use in HRM Analysis ..13 DefinitionAutocalling, Variant Calls.
2 8 TipHRM Analysis of Challenging DNA Samples ..9 High-Quality DNA Key to Successful HRM Analysis ..9 DNA Quality Considerations for Successful HRM Analysis ..9 Primer Design for Successful HRM Analysis ..12 Ideal Amplification Properties for Successful HRM Analysis ..14 Optimizing PCR Reagents for Successful HRM Analysis ..15 Other Suggestions for Successful HRM Analysis ..15 Other Resources General HRM ..3 Other Troubleshooting ..18 Product Primer Design List for HRM Analysis Suggested Reagents ..15 Real-Time PCR Systems for HRM Analysis ..16 Sidebars Resolution Melting (HRM) Analysis is a new, post-PCR Analysis method used for identifying genetic variation in nucleic acid sequences. Simple and fast, this method is based on PCR Melting (dissociation) curve techniques and is enabled by the recent availability of improved double-stranded DNA (dsDNA) binding dyes along with next-generation real-time PCR instrumentation and Analysis software.
3 HRM Analysis can discriminate DNA sequences based on their composition, length, GC content, or strand complementarity [1]. HRM Analysis differs from standard melt curve Analysis in three ways: 1. Chemistry HRM Analysis uses brighter dyes at higher concentrations 2. Instruments HRM Analysis requires instruments that collect fluorescence data at finer temperature Resolution 3. Software HRM Analysis requires more sophisticated software which uses new fluorescent scaling algorithms and plotsHRM Analysis starts with PCR amplification of the region of interest in the presence of a dsDNA-binding dye. This binding dye has high fluorescence when bound to dsDNA and low fluorescence in the unbound state. Amplification is followed by a high Resolution Melting step using instrumentation capable of capturing a large number of fluorescent data points per change in temperature, with high precision.
4 When the dsDNA dissociates (or melts) into single strands, the dye is released, causing a change in fluorescence. The result is a melt curve profile characteristic of the amplicon. HRM Analysis requires no manual post-PCR processing, is performed in a closed-tube system, and has a low reaction cost relative to other methods used to study genetic is a relatively new method, and this Guide provides a resource for scientists learning and perfecting the technique. Along with an introduction to HRM Analysis , information is provided on reaction optimization and technical problem solving. 1. IntroductionOther Resources General HRM Applied biosystems HRM Analysis Site Applied biosystems High Resolution Melting Software Getting Started Guide (PN 4393102; view at ) provides detailed, step-by-step procedures for HRM calibration and Analysis using Applied biosystems instruments and HRM software Applied biosystems High Resolution Melting Software Help (PN 4393101.)
5 View at ) describes HRM Analysis software and procedures for use Oligo Calculators to quickly calculate Tm, %GC, molecular weight, and other characteristics of oligonucleotides Applied biosystems oligonucleotide calculator OligoCalc PCR design software Primer Express software, included with Applied Biosytems instruments Methyl Primer Express software Primer3 Primer3 Plus Gene Quantification Information 1. IntroductionIn HRM Analysis , the region of interest is amplified by PCR in the presence of a fluorescent dsDNA-binding dye. Following PCR, the product is gradually melted, and the emitted fluorescence is measured on a specialized instrument to generate a characteristic curve. The resulting melt profile reflects the mix of amplicons present.
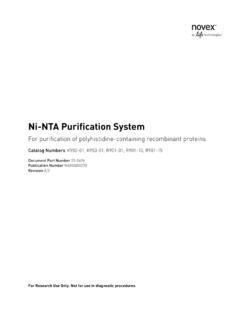
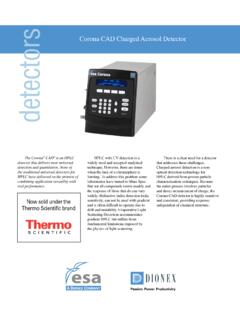
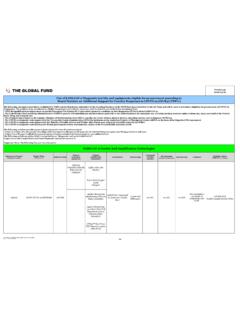
6 Aspects such as GC content, length, sequence, and heterozygosity will add to the melt curve characteristics for each amplicon. The resulting profiles can provide valuable information for mutation screening, genotyping, methylation, and other investigative Analysis uses two profile observations: 1. Melt curves that are similar in shape but that are distinguishable from each other by differences in Melting temperature (Tm) of the amplicon. Typically, such profiles are generated by homozygous variant samples that are being compared to a wild type sample. In such situations, the Tm difference between samples is due to sequence variation from the wild type. 2. Melt curves displaying a curve shape distinct from homozygote melt curves. These profiles are usually due to the presence of base-pairing mismatches (heteroduplexes) present in the PCR product 1 provides an example of HRM Analysis data to illustrate the different types of resulting profiles.
7 About HRM Analysis Figure 1. High Resolution Melt Curve With a Single Point Mutation. This is an aligned melt curve. The plot demonstrates the sharp decrease in fluorescence when the double-stranded DNA melts into its single-stranded form. Red = homozygous with guanine, Green = homozygous with adenine, Blue = (OC) Aligned Fluorescence (%) Ghom Ahet 1. IntroductionStandard DNA melt curve Analysis is a post-PCR Analysis method based on a biophysical measurement of the amplified DNA. Historically, it has been used for various applications, most commonly to detect primer-dimers or other nonspecific by-products of melt curve is generated by slowly denaturing ( Melting ) the DNA sample through a range of temperatures in the presence of a dsDNA-binding dye. During Melting , only dye bound to dsDNA fluoresces, and that fluorescence is continuously detected by an optical system.
8 Fluorescence is high when the dye is in its bound state, but when in solution, the dye changes conformation and fluorescence decreases 1, extent of Melting is measured by the change in fluorescence of the DNA sample. At low temperatures, the DNA will be double-stranded and the dye will strongly fluoresce. As the temperature increases, fluorescence will decrease 1,000-fold as the dye is released when the two strands denature. This decrease in fluorescence starts slowly, but when the double-stranded DNA melts into its single-stranded, fully denaturated form, a sharp decrease in fluorescence is detected (Figure 2A). The rate of fluorescence decrease is generally greatest near the Melting temperature (Tm) of the PCR product. The Tm is defined as the point in the melt curve where 50% of the DNA is double-stranded and 50% is single-stranded (melted).
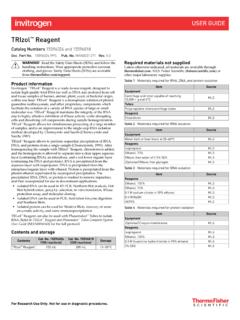
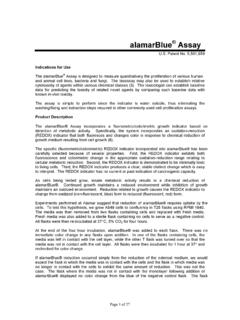
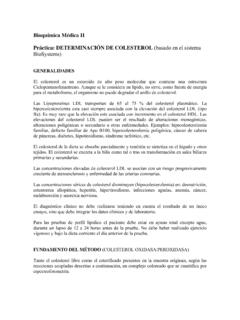
9 It equals the temperature at which the aligned fluorescence is 50% and is a function of PCR product characteristics, including GC content (Tm is higher in GC-rich PCR products), length, and sequence curve raw data are generally plotted as fluorescence vs. temperature. In general, melt curve Analysis software defines the Tm of a PCR product as the inflection point of the melt curve. To visualize the Tm more clearly, the negative first derivatives are often plotted, making the Tms of the products appear as peaks, as seen in Figure 2B. Nonspecific products may also appear in the derivative curve. These peaks are typically of lower intensity and represent products that are shorter in length, thus appearing at a lower temperature than the primary product. Because primer-dimers and other nonspecific PCR products can be seen in this data view, it can be a useful measure of PCR product Fundamentals of Fluorescent DNA Melting AnalysisFigure 2.
10 Real-Time PCR Data Showing a DNA Melt Profile. (A) A standard melt curve plot, showing the high initial fluorescence when all products are double-stranded and the maximum amount of dye is bound. As the temperature increases, the PCR products denature, dye is released, and the fluorescent signal drops. The vertical line is the point where 50% of the PCR products in the sample are denatured. (B) A derivative melt curve plot, which shows the inflection point on the slope as a more easily visualized melt , , , , , , , (OC) Normalized Reporter (Rn) 40, , (OC) Tm Reporter (-Rn) 20, , , , A. Standard Melt Curve. Panel B. Derivative Melt Curve. 1. IntroductionIn HRM Analysis , the same fundamental principles of DNA melt curve Analysis are applied along with further refinements.