Transcription of A Guide to Reading and Understanding the EKG
1 Version: 4/19/1999A Guide to Reading and Understanding the EKGW ritten by Henry Feldman, '01 Reviewed by Mariano Rey, MD, '76 The Online Version is available Guide will help you learn to interpret 12-lead EKG patterns. This is not a comprehensive Guide toEKG interpretation, and for further Reading , the Dubin textbook is the introductory book of text was developed for use by NYU School of Medicine students, but may be used by any medicalteaching institution, without charge, as long as the document is not modified, distributed in its entiretyand not used for profit, and may not be sold. Errors may be present in this document, and clinical use is at the risk of the user. Users should use their own clinical judgement in treatingpatients. 1999 Henry Feldman, Mariano Rey1 Table of ContentsEKG 1 - EKG Tracing ..Error! Bookmark not 1 ..1 Rate .. 1 Figure 2 - Determining the Rate .. 1 Step 2 ..2 Rhythm .. 2 Figure 3 - Determining the Rhythm Source.
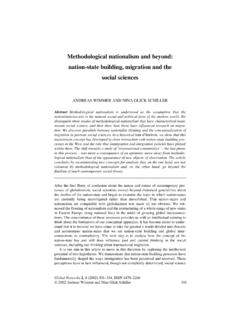
2 2 Step 3 .. 2 Figure 4 - The Limb and Augmented Leads in relation to the body .. 3 Figure 4 - Computing the Axis .. 4 Figure 5 - All limb and augmented leads .. 4 STEP 4 ..5 Precordial 5 Figure 6 - The Precordial Leads .. 5 STEP 5 ..5 Hypertrophy .. 5 Figure 7 - Biphasic P-Waves .. 6 Figure 8 - RVH .. 6 Figure 9 - LVH .. 7 STEP 6 ..7 Blocks .. 7 Figure 10 - AV-Block .. 7 STEP 7 ..9 Ischemia, Infarct and 9 Transmural Ischemia .. 9 Sub-Endocardial Ischemia .. 10 Figure 19 - ST-Segment Depression in subendocardial 10 Step 8 ..11 Miscellaneous ..11 Ventricular 11 Tachycardia .. 11 Sinus Tachycardia .. 12 Digitalis Toxicity .. 13 Figure 22 - Digitalis Toxicity .. 14 Hyperkalemia .. 14 Figure 23 - Peaked-T Waves consistent with ..15 Henry 15 Mariano Rey, MD .. 15 Other Contributors ..15 Daniel Fisher, 151 EKG TracingPlease refer to the EKG tracing below if you are not familiar with the labeling of the EKG 1- EKG TracingStep 1 RateThe first step is to determine the RATE, which can be eyeballed by the following technique.
3 Locatethe QRS (the big spike) complex that is closest to a dark vertical line. Then count either forward orbackwards to the next QRS complex. For each dark vertical line you pass, select the next number offthe mnemonic "300-150-100-75-60-50" to estimate the rate in beats per minute (BPM).In other words if you pass 2 lines before the next QRS, the heart rate (HR) would be less than that this is merely an estimate. You should use real measurements to determine the exactHR (for precise measurement: each large box represents 200msec and small boxes represent 40msec).As an example of using the mnemonic, in the segment of the EKG below, start at the QRS that linesup with the vertical line at "0". Now counting back each vertical line to the previous EKG "300-150-100" we notice the HR to be slightly less than 100 (probably around 90-95).Figure 2 - Determining the Rate2 Step 2 RhythmNext we need to determine the RHYTHM both its source and its regularity.
4 The prime concern iswhether the source of the rhythm is the SA node (sino-atrial) or an ectopic pacemaker. To determinewhether the source of the rhythm is "sinus" or an ectopic rhythm, you need to look at the relationshipof the P-wave, if present, to the QRS-complex. If there is a P wave before each QRS and the P is inthe same direction as the QRS, the rhythm can be said to be sinus. For instance note in the EKGsegment below that there is a P-wave before each QRS (highlighted in blue) and that it is pointing upas is the QRS 3 - Determining the Rhythm SourceAlso look at the quality and quantity of P-waves before each QRS. There should only be one P-wavebefore each QRS. The P-wave should be in only one direction, and not biphasic (except for leads V1and V2). It should also be closer than 200ms to the QRS. The shape of the P-wave should also begently rounded and not 3 AxisNext we need to determine the AXIS of the EKG tracing. To do this we need to understand the basic 6leads and their geometry.
5 The EKG waveform comes from a measurement of surface voltagesbetween 2 leads. A wave that is travelling towards the positive (+) lead will inscribe an upwardsdeflection of the EKG; conversely a wave traveling away from the positive lead will inscribe adownward deflection. Waves that are traveling at a 90 degree angle to a particular lead will create nodeflection and is called an isoelectric an example in the pictures below, a wave travelling from the head to the feet would be shown as anupwards deflection in AVF, since it is going towards the AVF+ axis is the sum of the vectors, produced by the ekg leads, to produce a single electrical that a positive signal in Lead-I means that the signal is going right to left; this produces avector, which if we take all the leads, we can sum. This summed vector should in general be pointingthe same direction (down-left) for a normal heart; this makes sense if we think of the electricalconduction system of the heart which sends a signal from the SA node (top right) to the purkinjefibers (bottom left).
6 Don't worry if you still don't get it, we'll give you a visual example further downthe are six basic leads discussed below and 6 precordial leads which will be discussed later. Thebasic leads consist of leads I, II and III and the augmented leads AVR, AVL and AVF. These arepresent on the basic 3-lead monitors and also on the 12-lead EKG machines. They consist of leads on3the left and right shoulders and one on the left side of the abdomen (although conceptually they are onthe wrists and above the ankle ; hence their name "limb leads"). A ground lead is placed on the rightankle. Figure 4 - The Limb and Augmented Leads in relation to the bodyYou will notice that leads I, II and III form the sides of an equilateral triangle, while AVR, AVL andAVF bisect the vertices of the triangle. The easiest way to figure out the axis is to draw a normal X-Ygraph and fill in the quadrants that are represented by each lead with a positive are some tricks to save you time, but first think about a normal EKG plot; in a normal EKGboth leads I and AVF will be positive as the signal travels from the SA node (top right of the heart) tothe tip of the ventricles (bottom left of the heart).
7 This is a normal axis, and leads us to the rule ofthumb, if I and AVF are positive the axis is normal. However, just because this is not the case doesnot mean that the axis is abnormal! (you need to look at more leads in this case) The normal axisactually allows the signal to travel up to 30 above the X axis and 30 to the left of the Y axis. Let'slook at an example below and prove this. Figure 4 - Computing the AxisIf the axis is not completely in the bottom left (the patient's left) quadrant ( I and AVF arepositive), it is simply a matter of using additional leads to determine the axis. Looking at the map ofall the leads, we notice that almost 360 degrees of axis are covered. Use the same axis determinationmethod you used with I and 5 - All limb and augmented leads5 Step 4 Precordial LeadsUnderstanding the precordial leads and how they align with the heart is critical to Understanding theEKG. First let's remember how the heart is located in the chest.
8 Note that it sits flat above thediaphragm on the left side of the chest, and is pointed slightly to the left. This is important inunderstanding how the precordial leads correlate to the actual heart anatomy. We see below theprecordial leads in their relationship to the heart and chest 6 - The Precordial LeadsV1-V2 are over the right ventricle, while V4-V6 primarily are over the left ventricle. V3 is atransitional lead, and is approximately over the intraventricular septum, so it covers some of bothventricles. Remember that the bulk of the left ventricle is posterior, so feel free to create a V7 and V8to get more information of the left 5 HypertrophyHypertrophy is the increase in size of the myocytes in the myocardium, leading to thicker walls. It canbe non-pathological, as in the case of people who frequently perform isometric exercise (lifting heavyweights, with the straining and Valsalva maneuver, produces an increased afterload).Extending this thought, we can see how hypertrophy can occur in the pathological sense by thinkingabout increased afterload on the heart as in individuals with high blood pressure which causes a leftsided afterload increase.
9 Left Sided afterload increases, such as systemic hypertension or aorticstenosis will cause the left ventricle (LV) to expand in response giving Left Ventricular Hypertrophy(LVH).6 The right side of the heart can also experience afterload. Increased pressure in the pulmonary vesselswill cause an increase in afterload (back-pressure) to the right ventricle (RV), leading to an increase inmuscle mass of the RV to compensate, leading to Right Ventricular Hypertrophy (RVH).As the ventricles, the atria can also become hypertrophic (dilated), which is visualized as changes tothe P-wave. The P-wave can become biphasic in bilateral atrial hypertrophy. The best place to lookfor Atrial Hypertrophy is in V1, which is mostly over the right atrium, but being the highest placedlead in the chest also gives left sided information as well). Below we see examples of Right and LeftAtrial Hypertrophy showing as biphasic 7 - Biphasic P-WavesNext we need to examining the ventricles for evidence of hypertrophy there.
10 Since increased musclemass, logically yields to an increase in the signal (more channels - more current) we would expect tosee changes in the QRS complex Right Ventricular Hypertrophy we look at V1 (and less so in V2 and V3) and notice that there is alarge R-wave (the normal V1 has a small R with a large S) Figure 8 - RVHThis increased R height, will taper down, in V2 and V3. Remember that just because you find RVHdoesn't mean that the left ventricle is also not hypertrophied, in which case you may not see thenormal Left Ventricular Hypertrophy (LVH), you will have a large S wave in V1 and a large R wave in actual criteria, are to add the height of S in V1 and the height of R in V5 (in mm) and if the sumis greater than 35mm, then LVH is probable. For instance in the picture below, we measure theheights (23mm in V1 and 17mm in V5) which total greater than 35mm, so we meet a criterion 9 - LVHStep 6 BlocksA block is an interruption of the normal flow of an electrical impulse traveling down from the SAnode to the ventricles.