Transcription of A Handbook of Technical Analysis
1 A Handbook of Technical Analysis A Handbook OF Technical Analysis 1 | P a g e CONTENTS Introduction 3 CHAPTER - 1 5 Types of Charts 5 : Line Charts: 6 : Bar Charts: 7 : Candlestick Chart: 7 CHAPTER - 2 9 trends 9 : Market Trend and Range-Bound Consolidation: 10 : Trendline & Channels: 12 Role Reversal: 14 : Channels 14 CHAPTER - 3 16 Volume 16 CHAPTER- 4 19 Classical Chart patterns 19 : Head and Shoulder & Inverse Head & Shoulder: 20 Double Tops and Bottoms: 21 : Triple Tops and Bottoms: 22 Triangles: 23 : Flag and Pennant: 24 Wedge: 25 CHAPTER 5 26 Candlestick Reversal Patterns 26 : Hammer: 27 : Shooting Star: 28 : Inverted-Hammer: 30 : Hanging Man: 30 : Bullish Engulfing Pattern: 31 : Bearish Engulfing Pattern: 32 A Handbook OF Technical Analysis 2 | P a g e : Piercing Pattern: 32 : Dark Cloud Cover: 33 : Doji: 33 CHAPTER - 6 35 Indicators 35 : Simple Moving Average: 36 : RSI: 37 : Calculation: 38 : Usage: 38 : ADX: 38 Conclusion 40 About Us 42 Elearnmarkets 43 A Handbook OF Technical Analysis 3 | P a g e Introduction A Handbook OF Technical Analysis 4 | P a g e Introduction.
2 Market Analysis is broadly categorized into two main methods, the first one is fundamental Analysis and the second one is Technical Analysis . In fundamental Analysis an analyst needs to look at the financial statements of a company, its business model, overall macroeconomic scenarios, management capabilities and many more things for coming to a specific fair value of a company. On the contrary the discipline of Technical Analysis is not at all concerned with this detailed study of fundamental factors. On the contrary, a Technical analyst only looks at price of a stock derived as a result of supply-demand interaction.
3 For a Technical analysts price is supreme and he or she sees price as manifestation of every fundamental reality. Hence, they look only at two main aspects in the market. Price -over -time and volume. The entire discipline of Technical Analysis is based on these two data points, price over time and volume. All patterns, indicators, concepts are derived from these two basic data points. Technical Analysis is a very interesting subject. This is not a definitive science, rather a probabilistic discipline. In simple terms, it is more of an art than science. There are well known chart patterns or indicators in the market. But nothing works 100% of time.
4 We still follow them because they work more number of times than they fail. Hence emerged the concept of probability, the number of times anything works among the number of times that occur. This ratio is different in different stocks in different phases. That is why it is called an art. With experience, a chartist is able to form an opinion of his or her own so that he has some extra edge on the market assessment than someone having just bookish knowledge of Technical Analysis . This book on Technical Analysis is your stepping stone towards the journey to become a seasoned Technical analyst. We request you to go through the concept slowly one at a time and keep observing charts on regular basis.
5 Look at old charts and also look at contemporary live charts. Once you find a pattern or some indicator try to predict the future move and note down your prediction. Then as time flows try to match the price action with your prediction. Then analyze why it worked or not worked. Make notes and progress with the e-book and the notes. This a long journey and we wish you best of luck. A Handbook OF Technical Analysis 5 | P a g e CHAPTER - 1 Types of Charts A Handbook OF Technical Analysis 6 | P a g e Chapter 1: Types of Charts Charts are two-dimensional representation of price over time. There are many types of charts available.
6 But most popular and widely used among them are Line Charts, Bar Charts and the Candlestick Charts. The X axis, the time axis is crucial. The unit can be month, week, day, hour, 5 min or few seconds. The shorter the time period, more detailed the chart becomes. The beauty of time in Technical Analysis is that the same concepts apply to charts irrespective of time-frame of observation. However, the success rate of individual patterns or indicators-based decisions may vary across time frames. Generally higher the time frame of chart, relatively higher is the probability of any concept in market. : Line Charts: In line chart each and every price point is represented as a dot.
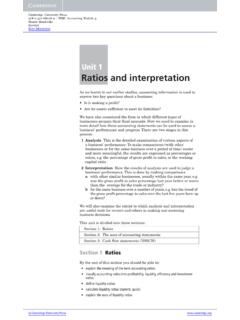
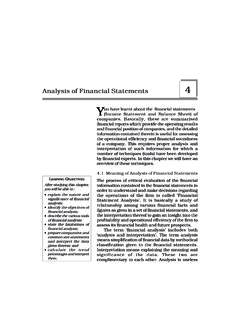
7 The X axis represents the time scale and the Y axis represents the price. Each dot or point represents the closing price at the end of a unit of time. These points are then joined to form a line. This is the simplest form of chart. But this is quite good if we want to plot 3-4 similarly priced stocks in a single chart and compare. Moreover, the line chart gives the clearest idea about price direction of a stock. Figure : Line Chart A Handbook OF Technical Analysis 7 | P a g e : Bar Charts: A bar chart is comprised of a series of bars. Every bar has four important price points - open close high and low. The bars are represented in green or blue color when close is higher than open and red color when close is lower than open.
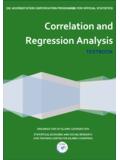
8 The bar charts are more detailed than the line chart and are good for demonstrating or spotting the classical price patterns. We will discuss about the classical chart patterns in appropriate time. Figure : Bar Chart : Candlestick Chart: The concept of candlestick charts came from Japan. That is why they are often referred to as Japanese candlestick charts. These charts are the most versatile and popular form of chart representation. Price behavior during each time unit is represented in the form of a candle. If the closing price of a stock is higher than open price during a particular time period, then the candle is green, if the close price is below the open price then the candle is red.
9 Each candle has a body and two wicks. The distance between open to close is represented by the body of a candle and the upper and lower wicks represent the highs and lows of a candle. A Handbook OF Technical Analysis 8 | P a g e Figure 1. 3(a): Candlestick Chart Diagrammatic Representation Candlestick chart is special not only because it adds a special visual clarity about the price action, but also because often a single candle stick or two or three consecutive candlesticks together form a pattern that indicate reversal of a prior move or give conviction on continuation of the ongoing move. These are called candlestick patterns.
10 We will discuss about them in due course of time. Figure: (b): Candlestick Chart Pattern Example After getting introduced to the concept of charting we will discuss about the concept of trend. A Handbook OF Technical Analysis 9 | P a g e CHAPTER - 2 trends A Handbook OF Technical Analysis 10 | P a g e Chapter 2: trends : Market Trend and Range-Bound Consolidation: Often market movements happen in the form of trends . A price trend is a continuous or a directional price movement in upward or downward direction. We call them up -trend and down -trend respectively. Now if we look at price action in market through charts, we will find that no price movement happens in a straight line.